File:Heatmap-gaps.png: Difference between revisions
<syntaxhighlight lang='r'> # 1. Prepare the data set.seed(42) mat = matrix(rnorm(30, mean = 0, sd = 1.2), nrow = 5, ncol = 6) mat[2, 1] = -2.5 mat[2, 6] = 2.5 mat[1, 2] = -1.8 mat[4, 4] = 1.8 # 2. Define the color palette library(circlize) col_fun = colorRamp2(c(-2.5, 0, 2.5), c("steelblue", "white", "darkred")) # 3. Create the heatmap object library(ComplexHeatmap) ht = Heatmap( mat, col = col_fun, cluster_rows = FALSE, cluster_columns = FALSE, show_row_names = FALSE, show_colu... |
|||
| Line 35: | Line 35: | ||
# 4. Draw the heatmap | # 4. Draw the heatmap | ||
draw(ht, heatmap_legend_side = "bottom") | |||
</syntaxhighlight> | |||
The RdBu (Red-Blue) palette from RColorBrewer is a "diverging" palette, which is ideal for data with a central neutral value (like 0) and extremes on both ends. | |||
<syntaxhighlight lang='r'> | |||
library(RColorBrewer) | |||
library(ComplexHeatmap) | |||
library(circlize) | |||
# Set up the data matrix | |||
set.seed(42) | |||
mat = matrix(rnorm(30, mean = 0, sd = 1.2), nrow = 5, ncol = 6) | |||
mat[2, 1] = -2.5 | |||
mat[2, 6] = 2.5 | |||
mat[1, 2] = -1.8 | |||
mat[4, 4] = 1.8 | |||
# Get the RdBu color palette and select the key colors | |||
# The RdBu palette is a red-to-blue gradient, so we reverse it to get blue-to-red | |||
rd_bu_palette = rev(brewer.pal(9, "RdBu")) | |||
three_colors = rd_bu_palette[c(1, 5, 9)] # Select the blue, white, and red shades | |||
# Use colorRamp2 to map the data range to these three colors | |||
col_fun = colorRamp2(c(-2.5, 0, 2.5), three_colors) | |||
# Create the heatmap object | |||
ht = Heatmap( | |||
mat, | |||
col = col_fun, | |||
cluster_rows = FALSE, | |||
cluster_columns = FALSE, | |||
show_row_names = FALSE, | |||
show_column_names = FALSE, | |||
border = "black", | |||
rect_gp = gpar( | |||
col = "white", | |||
lwd = 5 | |||
), | |||
heatmap_legend_param = list( | |||
title = "", | |||
direction = "horizontal", | |||
at = c(-2.5, 0, 2.5) | |||
) | |||
) | |||
# Draw the heatmap | |||
draw(ht, heatmap_legend_side = "bottom") | draw(ht, heatmap_legend_side = "bottom") | ||
</syntaxhighlight> | </syntaxhighlight> | ||
Latest revision as of 09:36, 7 August 2025
Summary
# 1. Prepare the data
set.seed(42)
mat = matrix(rnorm(30, mean = 0, sd = 1.2), nrow = 5, ncol = 6)
mat[2, 1] = -2.5
mat[2, 6] = 2.5
mat[1, 2] = -1.8
mat[4, 4] = 1.8

# 2. Define the color palette
library(circlize)
col_fun = colorRamp2(c(-2.5, 0, 2.5), c("steelblue", "white", "darkred"))

# 3. Create the heatmap object
library(ComplexHeatmap)
ht = Heatmap(
  mat,
  col = col_fun,
  cluster_rows = FALSE,
  cluster_columns = FALSE,
  show_row_names = FALSE,
  show_column_names = FALSE,
  border = "black",
  rect_gp = gpar(
    col = "white",
    lwd = 5 # Increased lwd to create a larger gap
  ),
  heatmap_legend_param = list(
    title = "",
    direction = "horizontal",
    at = c(-2.5, 0, 2.5)
  )
)

# 4. Draw the heatmap
draw(ht, heatmap_legend_side = "bottom")
The RdBu (Red-Blue) palette from RColorBrewer is a "diverging" palette, which is ideal for data with a central neutral value (like 0) and extremes on both ends.
library(RColorBrewer)
library(ComplexHeatmap)
library(circlize)

# Set up the data matrix
set.seed(42)
mat = matrix(rnorm(30, mean = 0, sd = 1.2), nrow = 5, ncol = 6)
mat[2, 1] = -2.5
mat[2, 6] = 2.5
mat[1, 2] = -1.8
mat[4, 4] = 1.8

# Get the RdBu color palette and select the key colors
# The RdBu palette is a red-to-blue gradient, so we reverse it to get blue-to-red
rd_bu_palette = rev(brewer.pal(9, "RdBu"))
three_colors = rd_bu_palette[c(1, 5, 9)] # Select the blue, white, and red shades

# Use colorRamp2 to map the data range to these three colors
col_fun = colorRamp2(c(-2.5, 0, 2.5), three_colors)

# Create the heatmap object
ht = Heatmap(
  mat,
  col = col_fun,
  cluster_rows = FALSE,
  cluster_columns = FALSE,
  show_row_names = FALSE,
  show_column_names = FALSE,
  border = "black",
  rect_gp = gpar(
    col = "white",
    lwd = 5
  ),
  heatmap_legend_param = list(
    title = "",
    direction = "horizontal",
    at = c(-2.5, 0, 2.5)
  )
)

# Draw the heatmap
draw(ht, heatmap_legend_side = "bottom")
File history
Click on a date/time to view the file as it appeared at that time.
| Date/Time | Thumbnail | Dimensions | User | Comment | |
|---|---|---|---|---|---|
| current | 09:17, 7 August 2025 | 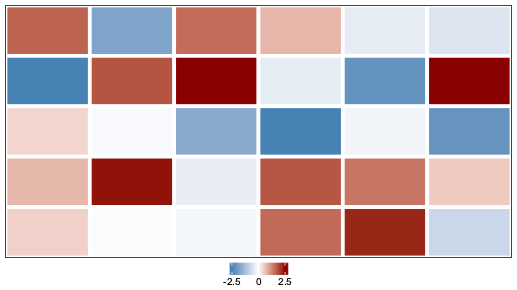 | 517 × 290 (4 KB) | Brb (talk | contribs) | <syntaxhighlight lang='r'> # 1. Prepare the data set.seed(42) mat = matrix(rnorm(30, mean = 0, sd = 1.2), nrow = 5, ncol = 6) mat[2, 1] = -2.5 mat[2, 6] = 2.5 mat[1, 2] = -1.8 mat[4, 4] = 1.8 # 2. Define the color palette library(circlize) col_fun = colorRamp2(c(-2.5, 0, 2.5), c("steelblue", "white", "darkred")) # 3. Create the heatmap object library(ComplexHeatmap) ht = Heatmap( mat, col = col_fun, cluster_rows = FALSE, cluster_columns = FALSE, show_row_names = FALSE, show_colu... |
You cannot overwrite this file.
File usage
The following page uses this file: