File:Umap-iris.png
No higher resolution available.
Umap-iris.png (600 × 600 pixels, file size: 25 KB, MIME type: image/png)
Summary
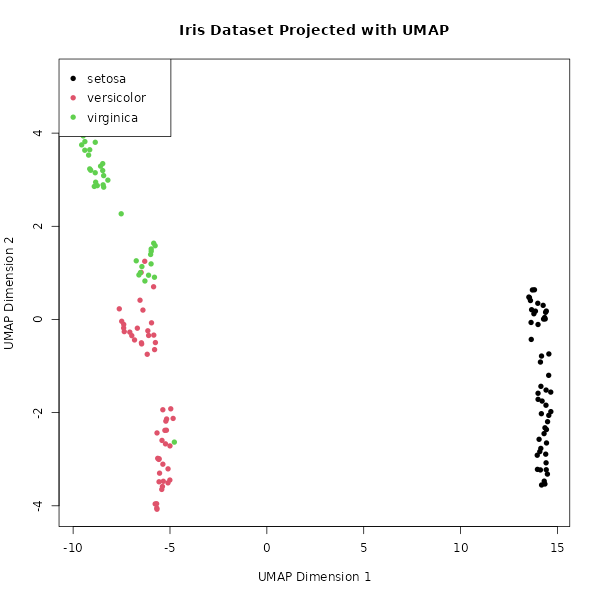
library(umap)

# Load the built-in Iris dataset
data(iris)

# Separate the features (variables) from the species labels
iris_features <- iris[, 1:4]
iris_species <- iris[, 5]

# Run UMAP, reducing the 4 dimensions down to 2
# n_neighbors: Controls how UMAP balances local vs. global structure.
# min_dist: Controls how tightly points are packed together.
iris_umap_results <- umap(iris_features, random_state = 42)

# The result is a list. The actual 2D coordinates are stored in $layout
head(iris_umap_results$layout)

# Create a data frame for plotting
plot_data <- data.frame(
  UMAP1 = iris_umap_results$layout[, 1],
  UMAP2 = iris_umap_results$layout[, 2],
  Species = iris_species
)

# Plot the results, colored by the original Species (group)
plot(plot_data$UMAP1, plot_data$UMAP2,
     col = plot_data$Species,
     pch = 16, # Solid circles
     main = "Iris Dataset Projected with UMAP",
     xlab = "UMAP Dimension 1",
     ylab = "UMAP Dimension 2")

# Add a legend
legend("topleft",
       legend = levels(plot_data$Species),
       col = 1:3,
       pch = 16)

library(ggplot2)
qplot(UMAP1, UMAP2, data = plot_data, color = Species)
File history
Click on a date/time to view the file as it appeared at that time.
| Date/Time | Thumbnail | Dimensions | User | Comment | |
|---|---|---|---|---|---|
| current | 17:16, 10 November 2025 | | 600 × 600 (25 KB) | Brb (talk | contribs) | <syntaxhighlight lang='r'> library(umap) # Load the built-in Iris dataset data(iris) # Separate the features (variables) from the species labels iris_features <- iris[, 1:4] iris_species <- iris[, 5] # Run UMAP, reducing the 4 dimensions down to 2 # n_neighbors: Controls how UMAP balances local vs. global structure. # min_dist: Controls how tightly points are packed together. iris_umap_results <- umap(iris_features, random_state = 42) # The result is a list. The actual 2D coordinates are... |
You cannot overwrite this file.
File usage
The following page uses this file: