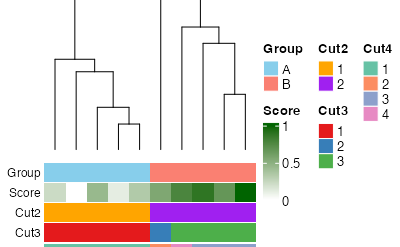
File:Dendro colorbars.png
No higher resolution available.
Dendro_colorbars.png (400 × 247 pixels, file size: 11 KB, MIME type: image/png)
Summary
library(ComplexHeatmap)
library(circlize)
library(RColorBrewer)

set.seed(123)

# --- Example data (10 samples) ---
mat <- matrix(rnorm(30), nrow = 10)
rownames(mat) <- paste0("Sample", 1:10)
mat[1:5, ] <- mat[1:5, ]
mat[6:10, ] <- mat[6:10, ] + 2

# Cluster on samples (rows)
hc <- hclust(dist(mat))

# Annotations in ORIGINAL sample order
groups <- rep(c("A", "B"), each = 5)
score <- seq(0, 1, length = 10)
cl2 <- cutree(hc, 2)
cl3 <- cutree(hc, 3)
cl4 <- cutree(hc, 4)

col_list <- list(
  Group = c(A = "skyblue", B = "salmon"),
  Score = colorRamp2(c(0, 1), c("white", "darkgreen")),
  Cut2  = c("1" = "orange", "2" = "purple"),
  Cut3  = setNames(brewer.pal(3, "Set1"), as.character(1:3)),
  Cut4  = setNames(brewer.pal(4, "Set2"), as.character(1:4))
)

anno_df <- data.frame(
  Group = groups,
  Score = score,
  Cut2 = factor(cl2),
  Cut3 = factor(cl3),
  Cut4 = factor(cl4),
  row.names = rownames(mat)
)

ha_bottom <- HeatmapAnnotation(
  df = anno_df,
  col = col_list,
  annotation_name_side = "left",
  annotation_name_gp = gpar(fontsize = 9)
  # simple_anno_size = unit(4, "mm")  # change bar thickness
)

# Dummy 1×N heatmap (invisible), dendrogram above it
dummy <- matrix(NA_real_,
  nrow = 1, ncol = nrow(mat),
  dimnames = list("blank", rownames(mat))
)

ht <- Heatmap(
  dummy,
  name = NULL,
  col = NULL,
  na_col = NA, # transparent cells (no gray)
  rect_gp = gpar(col = NA), # no borders
  cluster_rows = FALSE,
  cluster_columns = as.dendrogram(hc),
  show_heatmap_legend = FALSE,
  show_row_names = FALSE,
  show_column_names = TRUE,
  column_names_side = "bottom",
  column_names_gp = gpar(fontsize = 9),
  height = unit(2, "mm"), # keep the dummy heatmap body short
  column_dend_height = unit(60, "mm"), # make the dendrogram TALL
  bottom_annotation = ha_bottom
)

draw(ht, annotation_legend_side = "right")
draw(ht, annotation_legend_side = "bottom")
File history
Click on a date/time to view the file as it appeared at that time.
| Date/Time | Thumbnail | Dimensions | User | Comment | |
|---|---|---|---|---|---|
| current | 10:48, 1 December 2025 | | 400 × 247 (11 KB) | Brb (talk | contribs) | <syntaxhighlight lang='r'> library(ComplexHeatmap) library(circlize) library(RColorBrewer) set.seed(123) # --- Example data (10 samples) --- mat <- matrix(rnorm(30), nrow = 10) rownames(mat) <- paste0("Sample", 1:10) mat[1:5, ] <- mat[1:5, ] mat[6:10, ] <- mat[6:10, ] + 2 # Cluster on samples (rows) hc <- hclust(dist(mat)) # Annotations in ORIGINAL sample order groups <- rep(c("A", "B"), each = 5) score <- seq(0, 1, length = 10) cl2 <- cutree(hc, 2) cl3 <- cutree(hc, 3) cl4 <- cutree(hc,... |
You cannot overwrite this file.
File usage
The following page uses this file: