File:Combat DE mod.png

Size of this preview: 800 × 600 pixels. Other resolution: 2,400 × 1,800 pixels.
Original file (2,400 × 1,800 pixels, file size: 149 KB, MIME type: image/png)
Summary
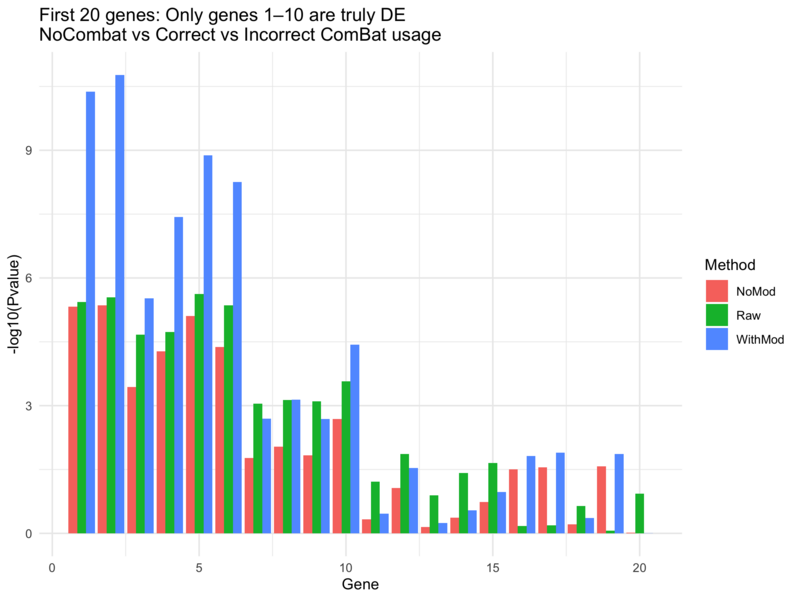
Demonstrate the importance of the 'mod' parameter in sva::ComBat()
library(sva)
library(limma)
library(ggplot2)
library(tidyr)

set.seed(42)

n_genes <- 100
n_samples <- 20

# Group: 10 Case and 10 Control — spread across batches
group <- sample(rep(c("Control", "Case"), each=10))  # now randomized
batch <- rep(c(1, 2), each=10)

# Simulate expression data
expr <- matrix(rnorm(n_genes * n_samples, mean=5, sd=1), nrow=n_genes)

# Add true signal to 10 genes for Case samples
expr[1:10, group == "Case"] <- expr[1:10, group == "Case"] + 2

# Add batch effect to all genes in batch 2
expr[, batch == 2] <- expr[, batch == 2] + 3

# Model matrix to preserve group
mod <- model.matrix(~ group)

# Apply ComBat — with and without mod
combat_with_mod <- ComBat(dat=expr, batch=batch, mod=mod)
combat_no_mod <- ComBat(dat=expr, batch=batch, mod=NULL)

# Compare differential expression results
design <- model.matrix(~ group)

fit_orig <- eBayes(lmFit(expr, design))
fit_with_mod <- eBayes(lmFit(combat_with_mod, design))
fit_no_mod <- eBayes(lmFit(combat_no_mod, design))

# Combine p-values
pvals <- data.frame(
  Gene = 1:n_genes,
  Raw = fit_orig$p.value[, 2],
  WithMod = fit_with_mod$p.value[, 2],
  NoMod = fit_no_mod$p.value[, 2]
)

pvals_long <- pivot_longer(pvals, -Gene, names_to = "Method", values_to = "Pvalue")

# Plot top 20 genes
ggplot(pvals_long[pvals_long$Gene <= 20, ], aes(x=Gene, y=-log10(Pvalue), fill=Method)) +
  geom_bar(stat="identity", position="dodge") +
  ggtitle("First 20 genes: Only genes 1–10 are truly DE\nNoCombat vs Correct vs Incorrect ComBat usage") +
  theme_minimal()
File history
Click on a date/time to view the file as it appeared at that time.
| Date/Time | Thumbnail | Dimensions | User | Comment | |
|---|---|---|---|---|---|
| current | 12:44, 20 May 2025 | | 2,400 × 1,800 (149 KB) | Brb (talk | contribs) | Demonstrate the importance of the 'mod' parameter in sva::ComBat() <syntaxhighlight lang='r'> library(sva) library(limma) library(ggplot2) library(tidyr) set.seed(42) n_genes <- 100 n_samples <- 20 # Group: 10 Case and 10 Control — spread across batches group <- sample(rep(c("Control", "Case"), each=10)) # now randomized batch <- rep(c(1, 2), each=10) # Simulate expression data expr <- matrix(rnorm(n_genes * n_samples, mean=5, sd=1), nrow=n_genes) # Add true signal to 10 genes for Case... |
You cannot overwrite this file.
File usage
The following page uses this file: