File:ComplexHeatmap2.png
Jump to navigation
Jump to search

No higher resolution available.
ComplexHeatmap2.png (800 × 600 pixels, file size: 43 KB, MIME type: image/png)
Summary
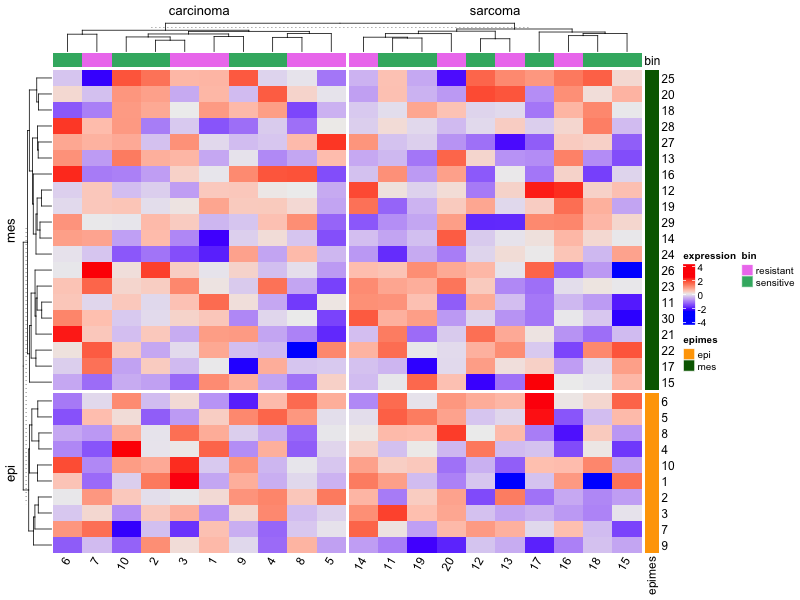
# Simulate data
library(ComplexHeatmap)
ng <- 30; ns <- 20
set.seed(1)
mat <- matrix(rnorm(ng*ns), nr=ng, nc=ns)
colnames(mat) <- 1:ns
rownames(mat) <- 1:ng

# color bar on RHS
ind_e <- 1:round(ng/3)
ind_m <- (1+round(ng/3)):ng
epimes <- rep(c("epi", "mes"), c(length(ind_e), length(ind_m)))
row_ha <- rowAnnotation(epimes = epimes,
        col = list(epimes = c("epi" = "orange", "mes" = "darkgreen")))

# color bar on Top
tumortype <- rep(c("carcinoma", "sarcoma"), c(round(ns/2), (ns-round(ns/2))))
bin <- sample(c("resistant", "sensitive"), ns, replace = T)
top_ha <- HeatmapAnnotation(bin = bin,
                        col = list(bin =c("resistant" = "violet",
                                          "sensitive" = "mediumseagreen")))

# combine
Heatmap(mat,
        name = "expression",
        column_split = tumortype,
        row_split = epimes,
        top_annotation = top_ha,   # color bat on top
        right_annotation = row_ha, # color bar on RHS
        show_row_names = TRUE,     # FALSE if ng is large
        column_names_rot = 60)
File history
Click on a date/time to view the file as it appeared at that time.
| Date/Time | Thumbnail | Dimensions | User | Comment | |
|---|---|---|---|---|---|
| current | 21:37, 7 January 2023 | | 800 × 600 (43 KB) | Brb (talk | contribs) | <syntaxhighlight lang="rsplus"> # Simulate data library(ComplexHeatmap) ng <- 30; ns <- 20 set.seed(1) mat <- matrix(rnorm(ng*ns), nr=ng, nc=ns) colnames(mat) <- 1:ns rownames(mat) <- 1:ng # color bar on RHS ind_e <- 1:round(ng/3) ind_m <- (1+round(ng/3)):ng epimes <- rep(c("epi", "mes"), c(length(ind_e), length(ind_m))) row_ha <- rowAnnotation(epimes = epimes, col = list(epimes = c("epi" = "orange", "mes" = "darkgreen"))) # color bar on Top tumortype <- rep(c("carcinoma", "sarcoma"... |
You cannot overwrite this file.
File usage
The following page uses this file: