File:Geom bar1.png
Jump to navigation
Jump to search


Size of this preview: 800 × 600 pixels. Other resolution: 2,400 × 1,800 pixels.
Original file (2,400 × 1,800 pixels, file size: 85 KB, MIME type: image/png)
Summary
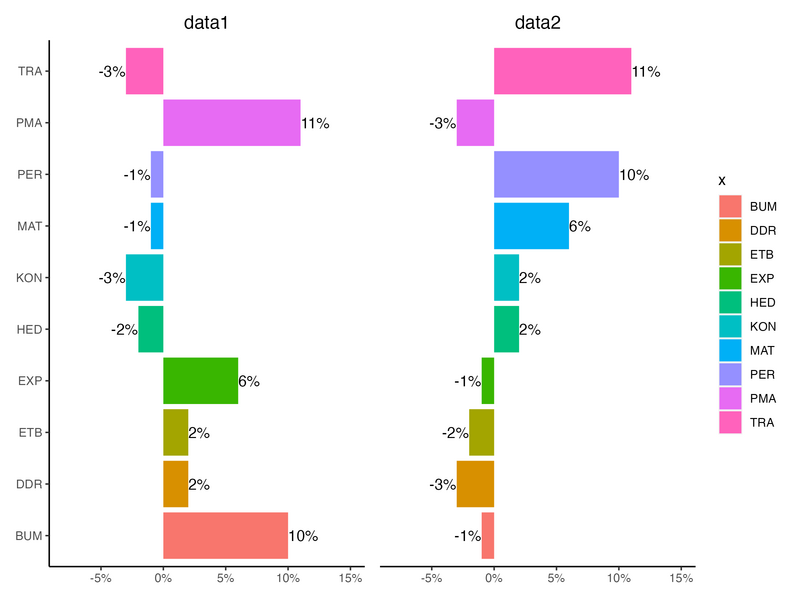
library(ggplot2)
library(scales)
library(patchwork)

dtf <- data.frame(x = c("ETB", "PMA", "PER", "KON", "TRA",
                           "DDR", "BUM", "MAT", "HED", "EXP"),
                     y = c(.02, .11, -.01, -.03, -.03, .02, .1, -.01, -.02, 0.06))
set.seed(1)
dtf2 <- data.frame(x = dtf[, 1], y = sample(dtf[, 2]))

g1 <- ggplot(dtf, aes(x, y)) +
  geom_bar(stat = "identity", aes(fill = x)) +
  geom_text(aes(label = paste0(y * 100, "%"),
                hjust = ifelse(y >= 0, 0, 1))) +
  scale_y_continuous("Anteil in Prozent",
                     limits = c(-.08, .15),
                     labels = percent_format()) +
  coord_flip() +
  theme(axis.title.x = element_blank(),
        axis.title.y = element_blank(),
        plot.title = element_text (hjust = 0.5),
        panel.background = element_blank(),
        axis.line = element_line(colour = "black")) +
   ggtitle("data1")

g2 <- ggplot(dtf2, aes(x, y)) +
  geom_bar(stat = "identity", aes(fill = x)) +
  geom_text(aes(label = paste0(y * 100, "%"),
                hjust = ifelse(y >= 0, 0, 1))) +
  scale_y_continuous("Anteil in Prozent",
                     limits = c(-.08, .15),
                     labels = percent_format()) +
  coord_flip() +                                                           # Remove axis labels & ticks
  theme(axis.text.y = element_blank(),
        axis.title.x = element_blank(),
        axis.title.y = element_blank(),
        axis.ticks.y = element_blank(),
        plot.title = element_text (hjust = 0.5)) +
  theme(
    # Remove panel border
    panel.border = element_blank(),
    # Remove panel grid lines
    # panel.grid.major = element_blank(),
    # panel.grid.minor = element_blank(),
    # Remove panel background
    panel.background = element_blank(),
    # Add axis line
    axis.line.x = element_line(colour = "black"),
    # Hide legend
    legend.position="none") +
  scale_x_discrete(breaks = NULL) +
  ggtitle("data2")

g1 + g2 + plot_layout(guides = "collect")
File history
Click on a date/time to view the file as it appeared at that time.
| Date/Time | Thumbnail | Dimensions | User | Comment | |
|---|---|---|---|---|---|
| current | 14:39, 15 December 2022 | | 2,400 × 1,800 (85 KB) | Brb (talk | contribs) | <pre> library(ggplot2) library(scales) library(patchwork) dtf <- data.frame(x = c("ETB", "PMA", "PER", "KON", "TRA", "DDR", "BUM", "MAT", "HED", "EXP"), y = c(.02, .11, -.01, -.03, -.03, .02, .1, -.01, -.02, 0.06)) set.seed(1) dtf2 <- data.frame(x = dtf[, 1], y = sample(dtf[, 2])) g1 <- ggplot(dtf, aes(x, y)) + geom_bar(stat = "identity", aes(fill = x)) + geom_text(aes(label = paste0(y * 100, "%"), hjust = ifelse(y >= 0,... |
You cannot overwrite this file.
File usage
The following page uses this file: