File:GseaTable2.png
Jump to navigation
Jump to search

No higher resolution available.
GseaTable2.png (800 × 600 pixels, file size: 81 KB, MIME type: image/png)
Summary
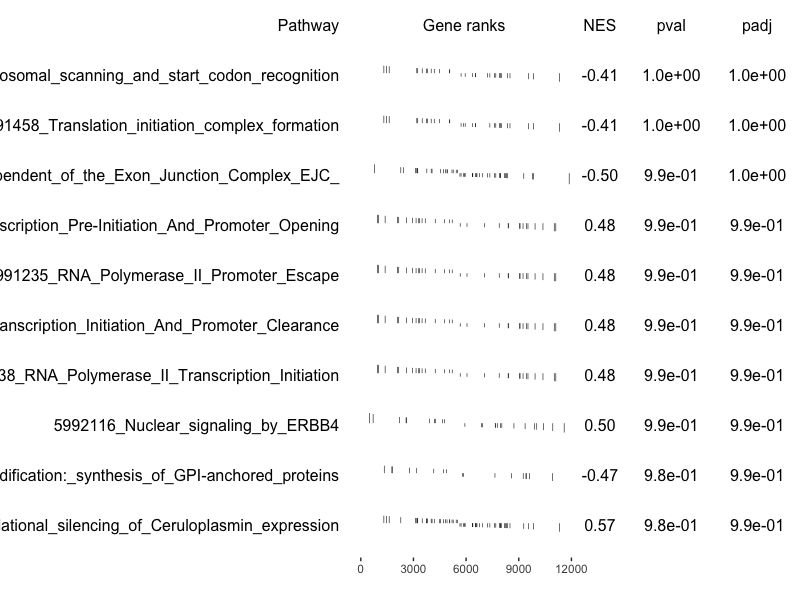
An example of a plot from 10 non-enriched pathways.
data(examplePathways)
data(exampleRanks)
fgseaRes <- fgsea(examplePathways, exampleRanks, nperm=1000,
                  minSize=15, maxSize=100)

fgseaRes[order(pval, decreasing = T),][1:10, c('NES', 'pval')]
#           NES      pval
# 1: -0.4050950 1.0000000
# 2: -0.4050950 1.0000000
# 3: -0.4966664 0.9932584
# 4:  0.4804114 0.9870610
# 5:  0.4804114 0.9870610
# 6:  0.4804114 0.9870610
# 7:  0.4804114 0.9870610
# 8:  0.4955139 0.9854545
# 9: -0.4694439 0.9832985
#10:  0.5686167 0.9827288

bottomPathways <- fgseaRes[order(pval, decreasing = T),][1:10, pathway]
plotGseaTable(examplePathways[bottomPathways], exampleRanks,
               fgseaRes, gseaParam=0.5)
File history
Click on a date/time to view the file as it appeared at that time.
| Date/Time | Thumbnail | Dimensions | User | Comment | |
|---|---|---|---|---|---|
| current | 12:18, 12 January 2023 | | 800 × 600 (81 KB) | Brb (talk | contribs) | An example of a plot from 10 non-enriched pathways. <pre> data(examplePathways) data(exampleRanks) fgseaRes <- fgsea(examplePathways, exampleRanks, nperm=1000, minSize=15, maxSize=100) fgseaRes[order(pval, decreasing = T),][1:10, c('NES', 'pval')] # NES pval # 1: -0.4050950 1.0000000 # 2: -0.4050950 1.0000000 # 3: -0.4966664 0.9932584 # 4: 0.4804114 0.9870610 # 5: 0.4804114 0.9870610 # 6: 0.4804114 0.9870610 # 7: 0.4804114 0.9870610 # 8: 0.4955139 0.9854... |
You cannot overwrite this file.
File usage
The following page uses this file: