File:Rotateheatmap.png
Jump to navigation
Jump to search

Size of this preview: 800 × 273 pixels. Other resolution: 1,314 × 448 pixels.
Original file (1,314 × 448 pixels, file size: 52 KB, MIME type: image/png)
Summary
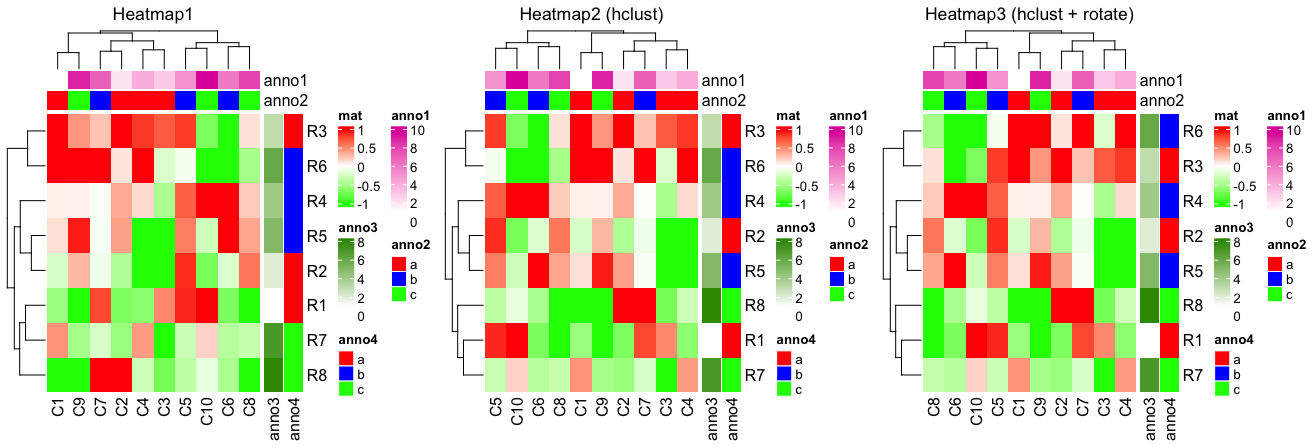
library(circlize)
set.seed(123)
mat = matrix(rnorm(80), 8, 10)
rownames(mat) = paste0("R", 1:8)
colnames(mat) = paste0("C", 1:10)
col_anno = HeatmapAnnotation(
              df = data.frame(anno1 = 1:10,
                              anno2 = rep(letters[1:3], c(4,3,3))),
              col = list(anno2 = c("a" = "red", "b" = "blue", "c" = "green")))
row_anno = rowAnnotation(
              df = data.frame(anno3 = 1:8,
                               anno4 = rep(letters[1:3], c(3,3,2))),
              col = list(anno4=c("a" = "red", "b" = "blue", "c" = "green")))
# 1st heatmap
Heatmap(mat,
        col = colorRamp2(c(-1, 0, 1), c("green", "white", "red")),
        top_annotation = col_anno, right_annotation = row_anno,
        name = "mat",              # legend for the color of the main heatmap
        column_title = "Heatmap1")  # top of the whole plot, default is ''

# 2nd heatmap. Use cluster_rows, cluster_columns,
# hclust() gives different orders than Heatmap()
hc_rows <- hclust(dist(mat))
hc_cols <- hclust(dist(t(mat)))
Heatmap(mat, cluster_rows=hc_rows, cluster_columns=hc_cols,
        col = colorRamp2(c(-1, 0, 1), c("green", "white", "red")),
        top_annotation = col_anno, right_annotation = row_anno,
        name = "mat",
        column_title = "Heatmap2 (hclust)")

# 3rd heatmap, Use cluster_rows, cluster_columns and dendextend::rotate()
# rotate the 1st 4 columns, switch the orders of the top 2 rows
hc_cols2 <- rotate(hc_cols, c(4,3,2,1,5:10))
hc_rows2 <- rotate(hc_rows, c(2:1,3:8))
Heatmap(mat, cluster_rows=hc_rows2, cluster_columns=hc_cols2,
        col = colorRamp2(c(-1, 0, 1), c("green", "white", "red")),
        top_annotation = col_anno, right_annotation = row_anno,
        name = "mat",
        column_title = "Heatmap3 (hclust + rotate)")
File history
Click on a date/time to view the file as it appeared at that time.
| Date/Time | Thumbnail | Dimensions | User | Comment | |
|---|---|---|---|---|---|
| current | 14:44, 13 August 2023 | 1,314 × 448 (52 KB) | Brb (talk | contribs) | <syntaxhighlight lang="rsplus"> library(circlize) set.seed(123) mat = matrix(rnorm(80), 8, 10) rownames(mat) = paste0("R", 1:8) colnames(mat) = paste0("C", 1:10) col_anno = HeatmapAnnotation( df = data.frame(anno1 = 1:10, anno2 = rep(letters[1:3], c(4,3,3))), col = list(anno2 = c("a" = "red", "b" = "blue", "c" = "green"))) row_anno = rowAnnotation( df = data.frame(anno3 = 1:8, anno4 = rep(l... |
You cannot overwrite this file.
File usage
The following page uses this file: