Search results
Jump to navigation
Jump to search
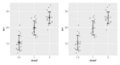
File:Rerrorbar.svg geom_jitter(position = position_jitter(0.2, seed=1), color = "darkgray") + geom_errorbar(aes(ymin = len-sd, ymax = len+sd), width=.2, data = df.summary)(609 × 328 (75 KB)) - 19:37, 24 March 2022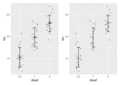
File:Rerrorbars.png geom_jitter(position = position_jitter(0.2, seed=1), color = "darkgray") + geom_errorbar(aes(ymin = len-sd, ymax = len+sd), width=.2, data = df.summary)(593 × 418 (10 KB)) - 19:39, 24 March 2022
File:ComplexHeatmap2.png tumortype <- rep(c("carcinoma", "sarcoma"), c(round(ns/2), (ns-round(ns/2))))(800 × 600 (43 KB)) - 21:37, 7 January 2023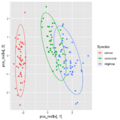
File:Pca ggplot2.png y = pca_res$x[,2],(1,000 × 1,000 (136 KB)) - 09:58, 23 May 2024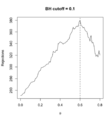
File:Filtered R.png abline(v=.6, lty=2)(1,020 × 1,096 (77 KB)) - 21:41, 11 March 2024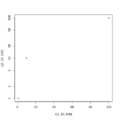
File:Logscale.png [1] 0 1 2(480 × 480 (4 KB)) - 13:58, 1 May 2020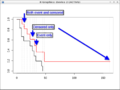
File:KMannotation.png # [,1] [,2] [,3] [,4] [,5] [,6] [,7] [,8] [,9] [,10] [,11] # 48 2 1 0.184 0.1535 0.0359 0.944(732 × 546 (58 KB)) - 22:12, 13 October 2020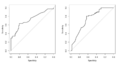
File:Roc asah.png par(mfrow=c(1,2))(1,024 × 535 (38 KB)) - 15:59, 22 August 2023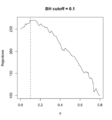
File:Filtered R mean.png abline(v=.1, lty=2)(1,020 × 1,096 (68 KB)) - 20:17, 12 March 2024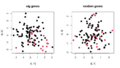
File:Doubledip.png k <- 2 # number of groups sum(r1$p.value < alpha) # 2(800 × 450 (57 KB)) - 14:19, 22 August 2022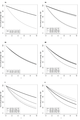
File:Progpreg.png x2 <- image_read(u[2])(800 × 1,200 (193 KB)) - 10:48, 24 September 2020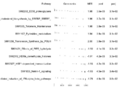
File:GseaTable.png # 2: 5992219_Regulation_of_cholesterol_biosynthesis_by_SREBP_SREBF_ 1.955961 # 5: 5991359_Translesion_Synthesis_by_POLH 2.003523(800 × 600 (81 KB)) - 12:01, 12 January 2023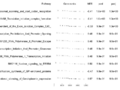
File:GseaTable2.png # 2: -0.4050950 1.0000000(800 × 600 (81 KB)) - 12:18, 12 January 2023
File:Geom bar2.png dtf2 <- data.frame(x = dtf[, 1], y = sample(dtf[, 2]))(2,400 × 1,800 (71 KB)) - 14:41, 15 December 2022
File:Geom bar1.png dtf2 <- data.frame(x = dtf[, 1], y = sample(dtf[, 2]))(2,400 × 1,800 (85 KB)) - 14:39, 15 December 2022


