Ggplot2
Books
- R for Data Science Chapter 28 Graphics for communication
- R Graphics Cookbook by Winston Chang. Lots of recipes. For example, the Axes chapter talks how to set/hide tick marks.
- The Hitchhiker's Guide to Ggplot2 in R
- ggplot2 book and its source code. Before I build the (pdf version) of the book, I need to follow this suggestion by running the following in R before calling make.
- Fundamentals of Data Visualization by Claus O. Wilke. The R code is in the Technical Notes section. The book is interesting. It educates how to produce meaningful and easy to read plots. The FAQs says the figure source code is not available.
- Data Visualization for Social Science
- R Graph Essentials Essentials by David Lillis. Chapters 3 and 4.
Tutorials
Some examples
- Top 50 ggplot2 Visualizations - The Master List
- http://blog.diegovalle.net/2015/01/the-74-most-violent-cities-in-mexico.html
- R Graph Catalog
Examples from 'R for Data Science' book - Aesthetic mappings
ggplot(data = mpg) +
  geom_point(mapping = aes(x = displ, y = hwy))

# template
ggplot(data = <DATA>) +
  <GEOM_FUNCTION>(mapping = aes(<MAPPINGS>))

# add another variable through color, size, alpha or shape
ggplot(data = mpg) +
  geom_point(mapping = aes(x = displ, y = hwy, color = class))

ggplot(data = mpg) +
  geom_point(mapping = aes(x = displ, y = hwy, size = class))

ggplot(data = mpg) +
  geom_point(mapping = aes(x = displ, y = hwy, alpha = class))

ggplot(data = mpg) +
  geom_point(mapping = aes(x = displ, y = hwy, shape = class))

ggplot(data = mpg) +
  geom_point(mapping = aes(x = displ, y = hwy), color = "blue")

# add another variable through facets
ggplot(data = mpg) +
  geom_point(mapping = aes(x = displ, y = hwy)) +
  facet_wrap(~ class, nrow = 2)

# add another 2 variables through facets
ggplot(data = mpg) +
  geom_point(mapping = aes(x = displ, y = hwy)) +
  facet_grid(drv ~ cyl)
Examples from 'R for Data Science' book - Geometric objects
# Points
ggplot(data = mpg) +
  geom_point(mapping = aes(x = displ, y = hwy))

# Smoothed
ggplot(data = mpg) +
  geom_smooth(mapping = aes(x = displ, y = hwy))

# Points + smoother
ggplot(data = mpg) +
  geom_point(mapping = aes(x = displ, y = hwy)) +
  geom_smooth(mapping = aes(x = displ, y = hwy))

# Colored points + smoother
ggplot(data = mpg, mapping = aes(x = displ, y = hwy)) +
  geom_point(mapping = aes(color = class)) +
  geom_smooth()
Examples from 'R for Data Science' book - Transformation
# y axis = counts
# bar plot
ggplot(data = diamonds) +
  geom_bar(mapping = aes(x = cut))
# Or
ggplot(data = diamonds) +
  stat_count(mapping = aes(x = cut))

# y axis = proportion
ggplot(data = diamonds) +
  geom_bar(mapping = aes(x = cut, y = ..prop.., group = 1))

# bar plot with 2 variables
ggplot(data = diamonds) +
  geom_bar(mapping = aes(x = cut, fill = clarity))
Color palette
- R -> Colors
- http://www.cookbook-r.com/Graphs/Colors_(ggplot2)/
- ggplot2 colors : How to change colors automatically and manually?
- ggpubr package which was used by survminer. The colors c("#00AFBB", "#FC4E07") are very similar to the colors used in ggsurvplot(). Colorblind-friendly palette
scales packages - ggplot2 default color palette
Emulate ggplot2 default color palette
Answer 1
gg_color_hue <- function(n) {
  hues = seq(15, 375, length = n + 1)
  hcl(h = hues, l = 65, c = 100)[1:n]
}

n = 4
cols = gg_color_hue(n)

dev.new(width = 4, height = 4)
plot(1:n, pch = 16, cex = 2, col = cols)
Answer 2 (better, it shows the color values in HEX). It should be read from left to right and then top to down.
scales package
library(scales)
show_col(hue_pal()(4))
Class variables
"Set1" is a good choice. See RColorBrewer::display.brewer.all()
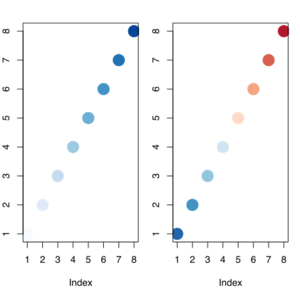
Heatmap for single channel
# White <----> Blue
RColorBrewer::display.brewer.pal(n = 8, name = "Blues")
Heatmap for dual channels
http://www.sthda.com/english/wiki/colors-in-r
library(RcolorBrewer)
# Red <----> Blue
display.brewer.pal(n = 8, name = 'RdBu')
# Hexadecimal color specification
brewer.pal(n = 8, name = "RdBu")

plot(1:8, col=brewer_pal(palette = "RdBu")(8), pch=20, cex=4)

# Blue <----> Red
plot(1:8, col=rev(brewer_pal(palette = "RdBu")(8)), pch=20, cex=4)
Themes and background for ggplot2
ggedit & ggplotgui – interactive ggplot aesthetic and theme editor
- https://www.r-statistics.com/2016/11/ggedit-interactive-ggplot-aesthetic-and-theme-editor/
- https://github.com/gertstulp/ggplotgui/. It allows to change text (axis, title, font size), themes, legend, et al. A docker website was set up for the online version.
ggconf: Simpler Appearance Modification of 'ggplot2'
https://github.com/caprice-j/ggconf
Plotting individual observations and group means
https://drsimonj.svbtle.com/plotting-individual-observations-and-group-means-with-ggplot2
subplot
Easy way to mix multiple graphs on the same page
- http://www.cookbook-r.com/Graphs/Multiple_graphs_on_one_page_(ggplot2)/
- Easy Way to Mix Multiple Graphs on The Same Page. Four packages are included: ggpubr, cowplot, gridExtra and grid.
- egg: Extensions for 'ggplot2', to Align Plots, Plot insets, and Set Panel Sizes.
- Why you should master small multiple chart
- gridExtra
x and y labels
https://stackoverflow.com/questions/10438752/adding-x-and-y-axis-labels-in-ggplot2 or the Labels part of the cheatsheet
You can set the labels with xlab() and ylab(), or make it part of the scale_*.* call.
labs(x = "sample size", y = "ngenes (glmnet)")
Legend title
scale_colour_manual("Treatment", values = c("black", "red"))
ylim and xlim in ggplot2
https://stackoverflow.com/questions/3606697/how-to-set-limits-for-axes-in-ggplot2-r-plots or the Zooming part of the cheatsheet
Use one of the following
- + scale_x_continuous(limits = c(-5000, 5000))
- + coord_cartesian(xlim = c(-5000, 5000))
- + xlim(-5000, 5000)
Center title
See the Legends part of the cheatsheet.
ggtitle("MY TITLE") +
  theme(plot.title = element_text(hjust = 0.5))
Time series plot
- How to make a line chart with ggplot2
- Colour palettes. Note some palette options like Accent from the Qualitative category will give a warning message In RColorBrewer::brewer.pal(n, pal) : n too large, allowed maximum for palette Accent is 8.
Multiple lines plot https://stackoverflow.com/questions/14860078/plot-multiple-lines-data-series-each-with-unique-color-in-r
set.seed(45)
nc <- 9
df <- data.frame(x=rep(1:5, nc), val=sample(1:100, 5*nc),
                   variable=rep(paste0("category", 1:nc), each=5))
# plot
# http://colorbrewer2.org/#type=qualitative&scheme=Paired&n=9
ggplot(data = df, aes(x=x, y=val)) +
    geom_line(aes(colour=variable)) +
    scale_colour_manual(values=c("#a6cee3", "#1f78b4", "#b2df8a", "#33a02c", "#fb9a99", "#e31a1c", "#fdbf6f", "#ff7f00", "#cab2d6"))
Versus old fashion
dat <- matrix(runif(40,1,20),ncol=4) # make data
matplot(dat, type = c("b"),pch=1,col = 1:4) #plot
legend("topleft", legend = 1:4, col=1:4, pch=1) # optional legend
Github style calendar plot
- https://mvuorre.github.io/post/2016/2016-03-24-github-waffle-plot/
- https://gist.github.com/marcusvolz/84d69befef8b912a3781478836db9a75 from Create artistic visualisations with your exercise data
geom_errorbar(): error bars
- Can ggplot2 do this? https://www.nature.com/articles/nature25173/figures/1
- plotCI() from the plotrix package or geom_errorbar() from ggplot2 package
- http://sape.inf.usi.ch/quick-reference/ggplot2/geom_errorbar
- Vertical error bars
- Horizontal error bars
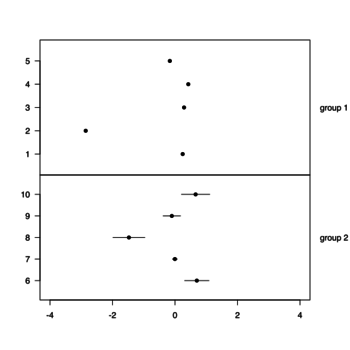
- Horizontal panel plot example and more
- R does not draw error bars out of the box. R has arrows() to create the error bars. Using just arrows(x0, y0, x1, y1, code=3, angle=90, length=.05, col). See
- Building Barplots with Error Bars. Note that the segments() statement is not necessary.
- https://www.rdocumentation.org/packages/graphics/versions/3.4.3/topics/arrows
- Toy example (see this nature paper)
set.seed(301)
x <- rnorm(10)
SE <- rnorm(10)
y <- 1:10

par(mfrow=c(2,1))
par(mar=c(0,4,4,4))
xlim <- c(-4, 4)
plot(x[1:5], 1:5, xlim=xlim, ylim=c(0+.1,6-.1), yaxs="i", xaxt = "n", ylab = "", pch = 16, las=1)
mtext("group 1", 4, las = 1, adj = 0, line = 1) # las=text rotation, adj=alignment, line=spacing
par(mar=c(5,4,0,4))
plot(x[6:10], 6:10, xlim=xlim, ylim=c(5+.1,11-.1), yaxs="i", ylab ="", pch = 16, las=1, xlab="")
arrows(x[6:10]-SE[6:10], 6:10, x[6:10]+SE[6:10], 6:10, code=3, angle=90, length=0)
mtext("group 2", 4, las = 1, adj = 0, line = 1)
text labels on scatterplots: ggrepel package
ggrepel package. Found on Some datasets for teaching data science by Rafael Irizarry.
Fonts
Adding Custom Fonts to ggplot in R
Save the plots
graphics::smoothScatter
BBC
- bbplot package from github
- BBC Visual and Data Journalism cookbook for R graphics from github
- How the BBC Visual and Data Journalism team works with graphics in R
Add your brand to ggplot graph
You Need to Start Branding Your Graphs. Here's How, with ggplot!

