File:Geomcolviridis.png

Size of this preview: 800 × 390 pixels. Other resolution: 821 × 400 pixels.
Original file (821 × 400 pixels, file size: 26 KB, MIME type: image/png)
Summary
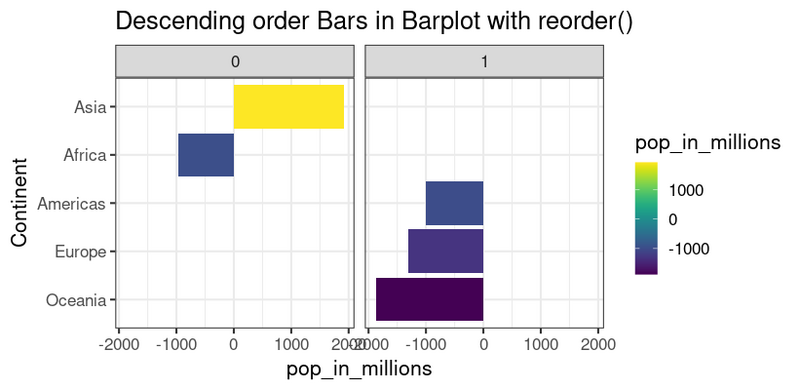
Modify the example from https://datavizpyr.com/re-ordering-bars-in-barplot-in-r/ to allow filled colors and facet.
library(tidyverse)
library(gapminder)
library(viridis)
theme_set(theme_bw(base_size=16))

pop_df <- gapminder %>%
     filter(year==2007)%>%
     group_by(continent) %>%
     summarize(pop_in_millions=sum(pop)/1e06)

pop_df2 <- tibble(class=rbinom(nrow(pop_df), 1, .5), pop_df)
pop_df2 <- pop_df2 |> mutate(pop_in_millions = pop_in_millions-1900)
pop_df2 %>%
     ggplot(aes(reorder(continent,
                        pop_in_millions),
                pop_in_millions))+
     geom_col(aes(fill = pop_in_millions)) +
     labs(x="Continent", title="Descending order Bars in Barplot with reorder()") +
     coord_flip() + facet_wrap(~class) + scale_fill_viridis()
File history
Click on a date/time to view the file as it appeared at that time.
| Date/Time | Thumbnail | Dimensions | User | Comment | |
|---|---|---|---|---|---|
| current | 10:50, 30 August 2022 | | 821 × 400 (26 KB) | Brb (talk | contribs) | Modify the example from https://datavizpyr.com/re-ordering-bars-in-barplot-in-r/ to allow filled colors and facet. <pre> library(tidyverse) library(gapminder) library(viridis) theme_set(theme_bw(base_size=16)) pop_df <- gapminder %>% filter(year==2007)%>% group_by(continent) %>% summarize(pop_in_millions=sum(pop)/1e06) pop_df2 <- tibble(class=rbinom(nrow(pop_df), 1, .5), pop_df) pop_df2 <- pop_df2 |> mutate(pop_in_millions = pop_in_millions-1900) pop_df2 %>% ggplot(aes... |
You cannot overwrite this file.
File usage
The following page uses this file: