File:Groupjitterboxplot.png

Size of this preview: 600 × 600 pixels. Other resolution: 1,000 × 1,000 pixels.
Original file (1,000 × 1,000 pixels, file size: 247 KB, MIME type: image/png)
Summary
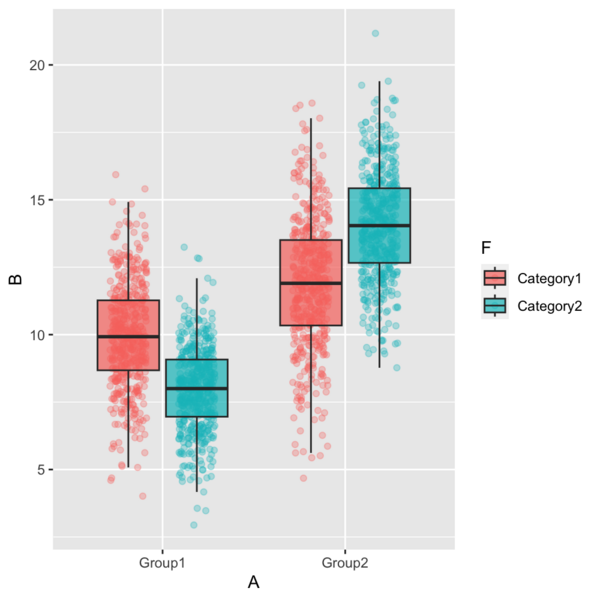
library(ggplot2)
library(dplyr)

# Create a sample dataset with large sample size
set.seed(42)
n_per_group <- 500  # 500 samples per group and category combination (2000 total)

data <- data.frame(
  A = rep(c("Group1", "Group2"), each = n_per_group * 2),
  B = c(rnorm(n_per_group, 10, 2), rnorm(n_per_group, 8, 1.5),   # Group1: Category1, Category2
        rnorm(n_per_group, 12, 2.5), rnorm(n_per_group, 14, 2)), # Group2: Category1, Category2
  F = rep(rep(c("Category1", "Category2"), each = n_per_group), 2)
)

# View data dimensions
dim(data)
# Check the first few rows
head(data)

# Visualize with jittered points under boxplots
data %>%
  ggplot(aes(x = A, y = B, fill = F)) +
  geom_jitter(aes(color = F),
              position = position_jitterdodge(jitter.width = 0.2,
                                             dodge.width = 0.75,
                                             seed = 123),
              alpha = 0.3) +
  geom_boxplot(outlier.shape = NA, alpha = 0.7)
File history
Click on a date/time to view the file as it appeared at that time.
| Date/Time | Thumbnail | Dimensions | User | Comment | |
|---|---|---|---|---|---|
| current | 13:33, 17 April 2025 | | 1,000 × 1,000 (247 KB) | Brb (talk | contribs) | <syntaxhighlight lang='r'> library(ggplot2) library(dplyr) # Create a sample dataset with large sample size set.seed(42) n_per_group <- 500 # 500 samples per group and category combination (2000 total) data <- data.frame( A = rep(c("Group1", "Group2"), each = n_per_group * 2), B = c(rnorm(n_per_group, 10, 2), rnorm(n_per_group, 8, 1.5), # Group1: Category1, Category2 rnorm(n_per_group, 12, 2.5), rnorm(n_per_group, 14, 2)), # Group2: Category1, Category2 F = rep(rep(c("Categ... |
You cannot overwrite this file.
File usage
The following page uses this file: