File:Plotly shiny 3d.png
Size of this preview: 800 × 437 pixels. Other resolution: 1,658 × 906 pixels.
Original file (1,658 × 906 pixels, file size: 135 KB, MIME type: image/png)
Summary
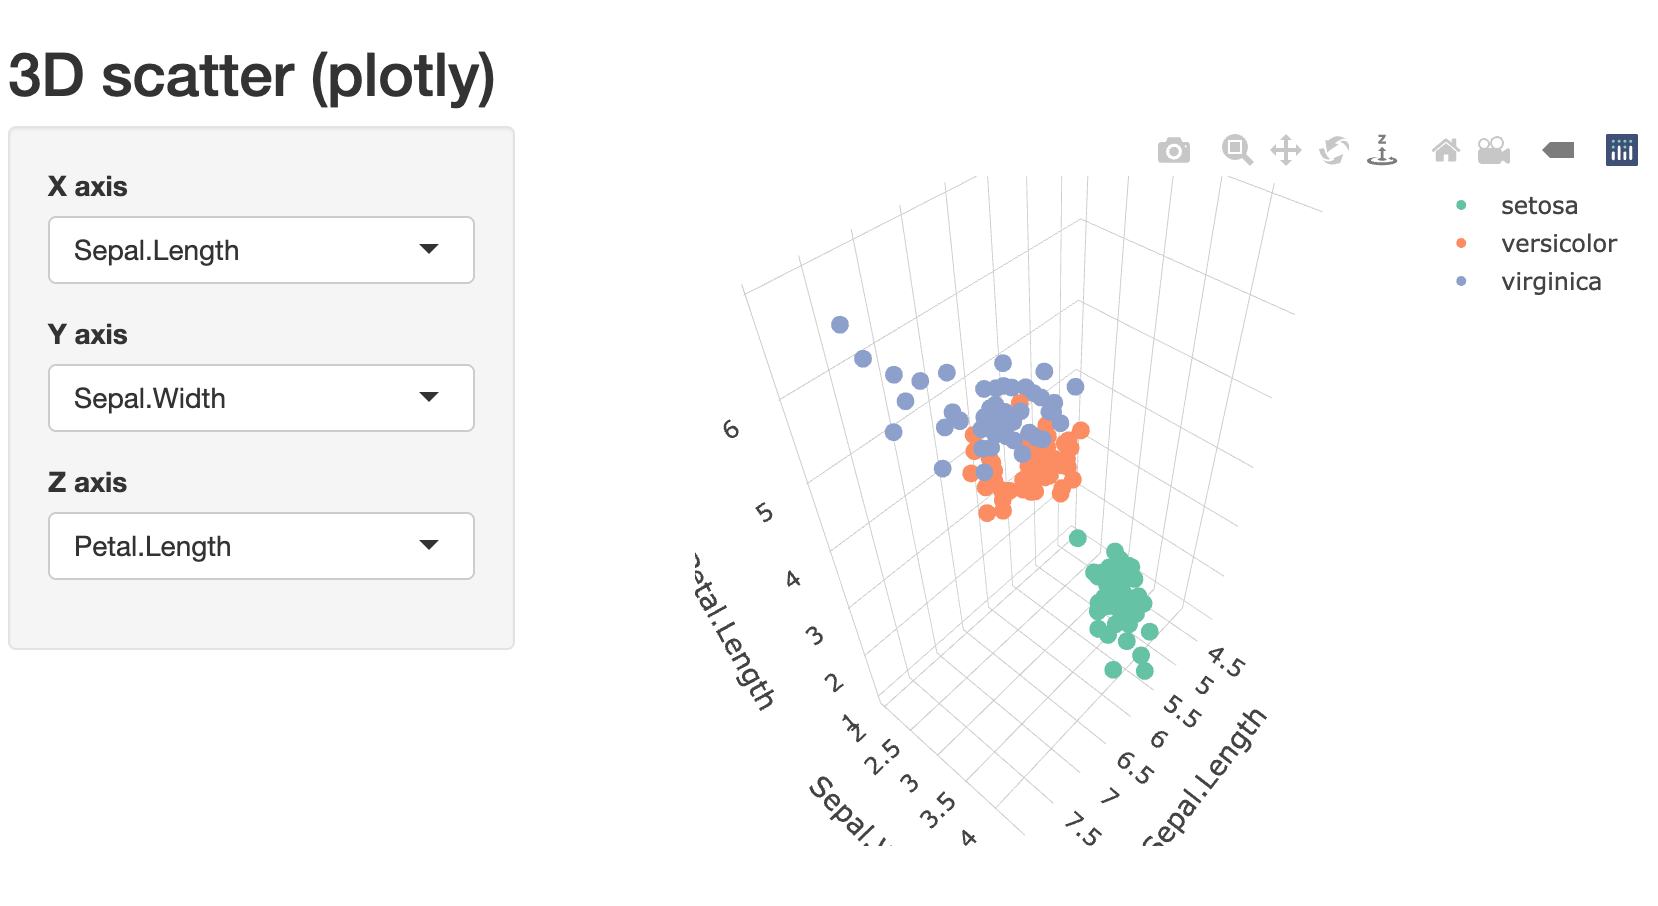
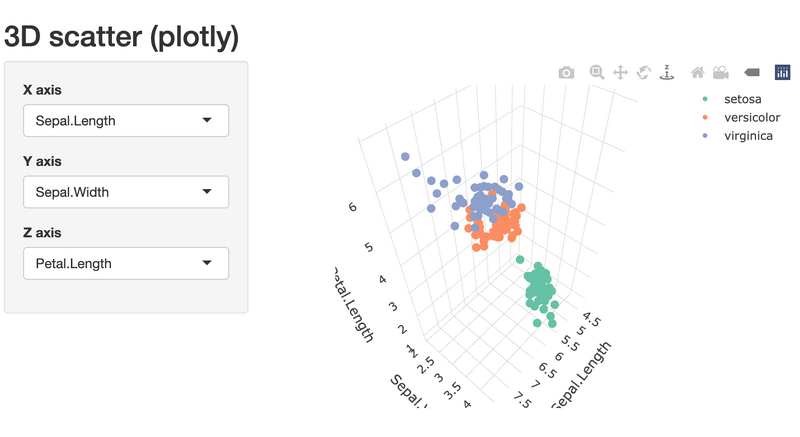
# method 3: install.packages(c("shiny","plotly"))
library(shiny)
library(plotly)

ui <- fluidPage(
  titlePanel("3D scatter (plotly)"),
  sidebarLayout(
    sidebarPanel(
      selectInput("x", "X axis", choices = names(iris), selected = "Sepal.Length"),
      selectInput("y", "Y axis", choices = names(iris), selected = "Sepal.Width"),
      selectInput("z", "Z axis", choices = names(iris), selected = "Petal.Length")
    ),
    mainPanel(plotlyOutput("plot3d"))
  )
)

server <- function(input, output, session) {
  output$plot3d <- renderPlotly({
    plot_ly(
      data = iris,
      x = as.formula(paste0("~", input$x)),
      y = as.formula(paste0("~", input$y)),
      z = as.formula(paste0("~", input$z)),
      color = ~Species, type = "scatter3d", mode = "markers",
      marker = list(size = 5)
    ) %>% layout(scene = list(xaxis=list(title=input$x), yaxis=list(title=input$y), zaxis=list(title=input$z)))
  })
}

shinyApp(ui, server)
File history
Click on a date/time to view the file as it appeared at that time.
| Date/Time | Thumbnail | Dimensions | User | Comment | |
|---|---|---|---|---|---|
| current | 13:51, 19 February 2026 | | 1,658 × 906 (135 KB) | Brb (talk | contribs) | <syntaxhighlight lang='r'> # method 3: install.packages(c("shiny","plotly")) library(shiny) library(plotly) ui <- fluidPage( titlePanel("3D scatter (plotly)"), sidebarLayout( sidebarPanel( selectInput("x", "X axis", choices = names(iris), selected = "Sepal.Length"), selectInput("y", "Y axis", choices = names(iris), selected = "Sepal.Width"), selectInput("z", "Z axis", choices = names(iris), selected = "Petal.Length") ), mainPanel(plotlyOutput("plot3d")) )... |
You cannot overwrite this file.
File usage
The following page uses this file: