File:RbdGeom.png: Difference between revisions
Jump to navigation
Jump to search
(<pre> require(ggplot2) aggregate( .~ treatment +block,FUN=median, data = data) |> ggplot(aes(treatment, yield)) + geom_line(aes(group = block, color = block), linewidth = 1.2) + geom_point(aes(color = block), shape = 15, size=2.6) </pre>) |
|||
| Line 6: | Line 6: | ||
ggplot(aes(treatment, yield)) + | ggplot(aes(treatment, yield)) + | ||
geom_line(aes(group = block, color = block), linewidth = 1.2) + | geom_line(aes(group = block, color = block), linewidth = 1.2) + | ||
geom_point(aes(color = block), shape = 15, size=2.6) | geom_point(aes(color = block), shape = 15, size=2.6) + | ||
ggExtra::removeGridX() # Remove vertical grids but keep ticks on x-axis | |||
</pre> | </pre> | ||
Latest revision as of 22:39, 14 January 2023
Summary
require(ggplot2)

aggregate( .~ treatment +block,FUN=median, data = data)  |>
  ggplot(aes(treatment, yield)) +
  geom_line(aes(group = block, color = block), linewidth = 1.2) +
  geom_point(aes(color = block), shape = 15, size=2.6) +
  ggExtra::removeGridX()  # Remove vertical grids but keep ticks on x-axis
File history
Click on a date/time to view the file as it appeared at that time.
| Date/Time | Thumbnail | Dimensions | User | Comment | |
|---|---|---|---|---|---|
| current | 22:26, 14 January 2023 | 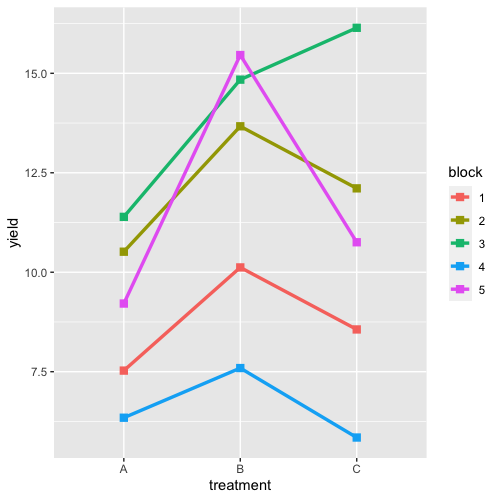 | 500 × 500 (41 KB) | Brb (talk | contribs) | <pre> require(ggplot2) aggregate( .~ treatment +block,FUN=median, data = data) |> ggplot(aes(treatment, yield)) + geom_line(aes(group = block, color = block), linewidth = 1.2) + geom_point(aes(color = block), shape = 15, size=2.6) </pre> |
You cannot overwrite this file.
File usage
The following page uses this file: