File:Silentnight.png: Difference between revisions
Jump to navigation
Jump to search
(depth <- 9 angle<-30 #Between branches division L <- 0.90 #Decreasing rate of branches by depth nstars <- 300 #Number of stars to draw mstars <- matrix(runif(2*nstars), ncol=2) branches <- rbind(c(1,0,0,abs(jitter(0)),1,jitter(5, amount = 5)), data.fra...) |
(Replaced content with "See the source code from https://aschinchon.wordpress.com/2014/03/13/the-lonely-acacia-is-rocked-by-the-wind-of-the-african-night/") |
||
| Line 1: | Line 1: | ||
See the source code from https://aschinchon.wordpress.com/2014/03/13/the-lonely-acacia-is-rocked-by-the-wind-of-the-african-night/ | |||
Latest revision as of 10:14, 1 March 2016
File history
Click on a date/time to view the file as it appeared at that time.
| Date/Time | Thumbnail | Dimensions | User | Comment | |
|---|---|---|---|---|---|
| current | 10:13, 1 March 2016 | 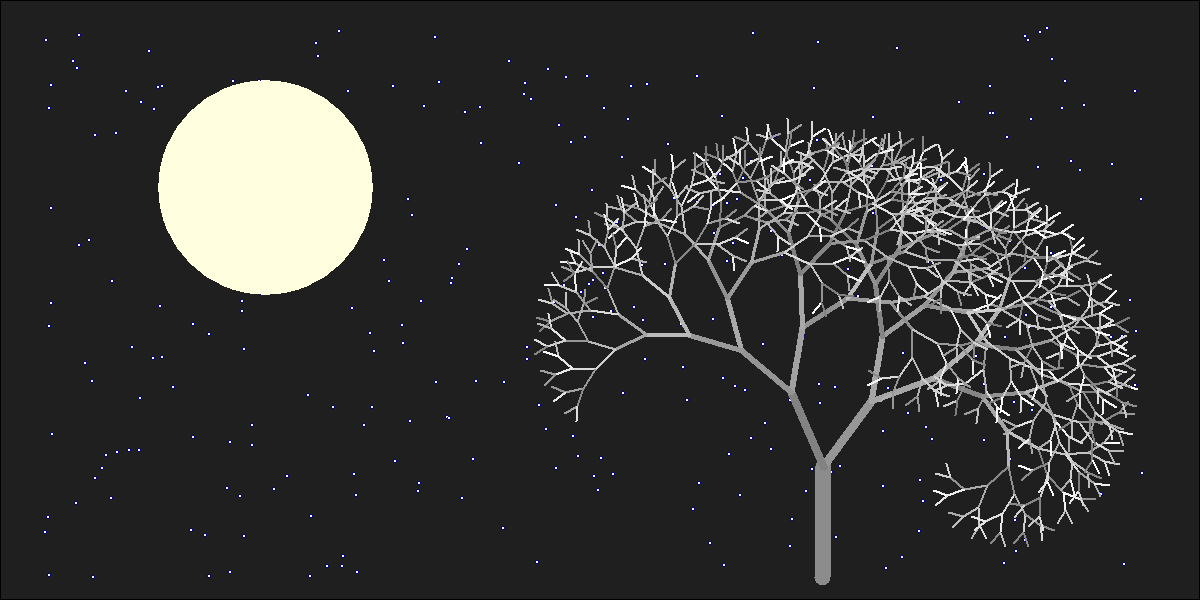 | 1,200 × 600 (57 KB) | Brb (talk | contribs) | depth <- 9 angle<-30 #Between branches division L <- 0.90 #Decreasing rate of branches by depth nstars <- 300 #Number of stars to draw mstars <- matrix(runif(2*nstars), ncol=2) branches <- rbind(c(1,0,0,abs(jitter(0)),1,jitter(5, amount = 5)), data.fra... |
You cannot overwrite this file.
File usage
The following page uses this file: