Search results
Jump to navigation
Jump to search
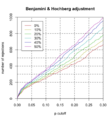
File:Filtered p.png # Each curve represents theta (filtering threshold). For example, theta=.1 means 10% of genes are filtered out before we do multiple testing (or BH ad #* if theta=0, 251 hypotheses are rejected at FDR=.1(1,020 × 1,096 (171 KB)) - 21:35, 11 March 2024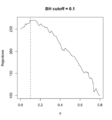
File:Filtered R mean.png # 10% <---- so theta=0.1 is the optimal; only 10% genes are removed # [1] 270(1,020 × 1,096 (68 KB)) - 20:17, 12 March 2024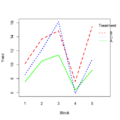
File:RbdBlock.png block <- as.factor(rep(1:5, each=6)) random_effect <- rnorm(30, mean = 0, sd = 1)(500 × 500 (34 KB)) - 21:51, 14 January 2023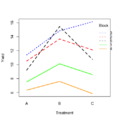
File:RbdTreat.png block <- as.factor(rep(1:5, each=6)) random_effect <- rnorm(30, mean = 0, sd = 1)(500 × 500 (32 KB)) - 21:50, 14 January 2023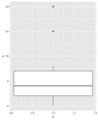
File:Geom boxplot.png ggplot(data.frame(x), aes(1, x)) + geom_boxplot()(436 × 536 (14 KB)) - 16:02, 25 November 2019
File:Geom bar2.png y = c(.02, .11, -.01, -.03, -.03, .02, .1, -.01, -.02, 0.06)) set.seed(1)(2,400 × 1,800 (71 KB)) - 14:41, 15 December 2022
File:Geom bar1.png y = c(.02, .11, -.01, -.03, -.03, .02, .1, -.01, -.02, 0.06)) set.seed(1)(2,400 × 1,800 (85 KB)) - 14:39, 15 December 2022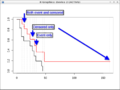
File:KMannotation.png # [,1] [,2] [,3] [,4] [,5] [,6] [,7] [,8] [,9] [,10] [,11] # status 1 1 0 1 1 0 1 1 0 1 0(732 × 546 (58 KB)) - 22:12, 13 October 2020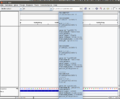
File:IGV fly Anders2013 2.png Note that a position may contain more than 1 transcript.(1,033 × 854 (102 KB)) - 14:50, 21 May 2015
File:Geom bar4.png color = "grey", linetype = "dashed", size = 1) +(2,400 × 1,800 (51 KB)) - 15:14, 15 December 2022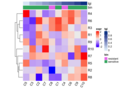
File:ComplexHeatmap1.png rownames(mat) = paste0("R", 1:ng) colnames(mat) = paste0("C", 1:n)(600 × 450 (29 KB)) - 15:02, 23 August 2022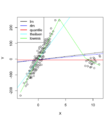
File:DataOutliers2.png plot(puree[,1], puree[, 2], xlab="X", ylab="Y") col = c("black", "blue", "red", "cyan", "green"), lty=1, lwd=2)(1,020 × 1,096 (133 KB)) - 16:49, 8 March 2024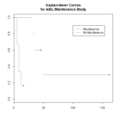
File:KMcurve.png # https://www.rdocumentation.org/packages/survival/versions/3.1-12/topics/print.survfit 1 Maintained 45(672 × 671 (6 KB)) - 16:15, 30 April 2020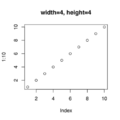
File:Svg4.svg plot(1:10, main="width=4, height=4")(360 × 360 (33 KB)) - 16:58, 17 March 2023
File:Palettebarplot.png barplot(rep(1, length(pal)), col = pal, space = 0,(534 × 615 (9 KB)) - 11:15, 10 May 2023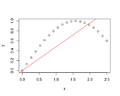
File:R2.png # [1] 0.8554949(500 × 400 (15 KB)) - 13:46, 21 May 2023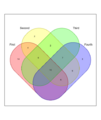
File:Venn4.png x <- list(First = 1:40, Second = 15:60, Third = sample(25:50, 25),(982 × 1,168 (103 KB)) - 14:49, 23 April 2024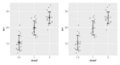
File:Rerrorbar.svg geom_jitter(position = position_jitter(0.2, seed=1), color = "darkgray") + geom_jitter(position = position_jitter(0.2, seed=1), color = "darkgray") +(609 × 328 (75 KB)) - 19:37, 24 March 2022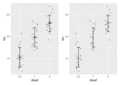
File:Rerrorbars.png geom_jitter(position = position_jitter(0.2, seed=1), color = "darkgray") + geom_jitter(position = position_jitter(0.2, seed=1), color = "darkgray") +(593 × 418 (10 KB)) - 19:39, 24 March 2022
File:LogisticFail.svg > set.seed(1234); n <- 16; mu=3; x <- c(rnorm(n), rnorm(n, mu)); y <- rep(0:1, each=n)(475 × 468 (25 KB)) - 10:08, 26 May 2022


