Search results
Jump to navigation
Jump to search
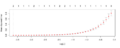
File:Cvglmnetplot.png set.seed(1) # [1] 39(1,000 × 400 (34 KB)) - 17:56, 11 October 2022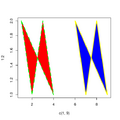
File:Polygon.png plot(c(1, 9), 1:2, type = "n") polygon(1:9, c(2,1,2,1,NA,2,1,2,1),(577 × 577 (30 KB)) - 17:31, 23 April 2024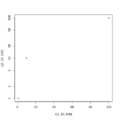
File:Logscale.png > plot(c(1, 10, 100), c(1, 10, 100), log="y") > log10(c(1, 10, 100))(480 × 480 (4 KB)) - 13:58, 1 May 2020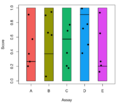
File:Jitterbox.png assy <- LETTERS[1:nc] set.seed(1)(1,020 × 906 (50 KB)) - 22:53, 8 February 2024
File:Reorder.dendrogram.png par(mfrow=c(3, 1)) plot(dd, main = "random dendrogram 'dd'") # not the same as reorder(dd, 1:20)(814 × 600 (10 KB)) - 12:15, 8 January 2023
File:ViridisDefault.png 1:n, 1, as.matrix(1:n),(600 × 200 (2 KB)) - 10:31, 30 August 2022
File:Twopalette.svg par(mfrow=c(1,2), mar = c(5,2,2,1)) plot(1:8, col=brewer_pal(palette = "Blues")(8), pch=20, cex=4)(468 × 468 (43 KB)) - 16:09, 12 April 2019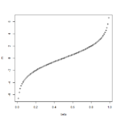
File:Methybetavsm.png mydf = data.frame(beta=seq(0,1,length=100), m=log2(seq(0,1,len=100)/(1-seq(0,1,len=100))))(480 × 480 (3 KB)) - 10:21, 30 July 2015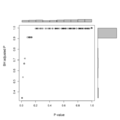
File:Scatterhist.svg zones=matrix(c(2,0,1,3), ncol=2, byrow=TRUE) layout(zones, widths=c(4/5,1/5), heights=c(1/5,4/5))(563 × 563 (70 KB)) - 10:22, 16 February 2024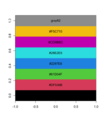
File:Rpalette.png # [1] "black" "#DF536B" "#61D04F" "#2297E6" "#28E2E5" "#CD0BBC" "#F5C710" pal_matrix <- matrix(seq_along(pal), nr=1)(534 × 615 (28 KB)) - 11:08, 10 May 2023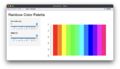
File:Rainbow default.png sliderInput("s_value", "Saturation (s):", min = 0, max = 1, value = 1, step = 0.01), sliderInput("v_value", "Value (v):", min = 0, max = 1, value = 1, step = 0.01)(2,044 × 1,182 (426 KB)) - 08:52, 12 March 2024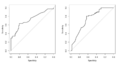
File:Roc asah.png par(mfrow=c(1,2)) par(mfrow=c(1,1))(1,024 × 535 (38 KB)) - 15:59, 22 August 2023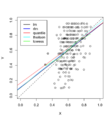
File:DataOutliers.png plot(puree[,1], puree[, 2], xlim=c(0,1), ylim=c(0,1), xlab="X", ylab="Y") abline(0,1, lty=2)(1,020 × 1,096 (172 KB)) - 15:27, 7 March 2024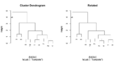
File:Dend12.png # [1] 8 3 6 5 10 1 9 7 2 4 # Rotate the branches (1,9) & (7,2,4)(876 × 448 (11 KB)) - 13:17, 13 August 2023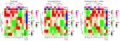
File:Rotateheatmap.png rownames(mat) = paste0("R", 1:8) colnames(mat) = paste0("C", 1:10)(1,314 × 448 (52 KB)) - 14:44, 13 August 2023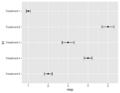
File:Geomerrorbarh.png trt = factor(c("Treatment 1", "Treatment 2", "Treatment 3", "Treatment 4", "Treatment 5")), # treatment resp = c(1, 5, 3, 4, 2), # response(516 × 400 (17 KB)) - 20:38, 15 October 2023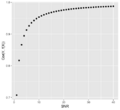
File:SnrVScor.png tibble(snr = seq(1,40)) %>% mutate(cor=sqrt(snr)/sqrt(snr+1)) %>%(483 × 443 (20 KB)) - 14:15, 18 March 2022
File:ComplexHeatmap2.png set.seed(1) colnames(mat) <- 1:ns(800 × 600 (43 KB)) - 21:37, 7 January 2023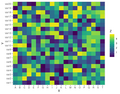
File:ScaleFillViridisDiscrete.png x <- LETTERS[1:20] y <- paste0("var", seq(1,20))(600 × 471 (22 KB)) - 10:08, 30 August 2022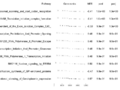
File:GseaTable2.png fgseaRes[order(pval, decreasing = T),][1:10, c('NES', 'pval')] # 1: -0.4050950 1.0000000(800 × 600 (81 KB)) - 12:18, 12 January 2023


