Search results
Jump to navigation
Jump to search
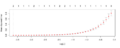
File:Cvglmnetplot.png # 0 1 1 1 1 1 1 1 1 1 1 1 1 2 1 # 1 1 2 2 1 2 2 1 1 1 2 1 1 1 2(1,000 × 400 (34 KB)) - 17:56, 11 October 2022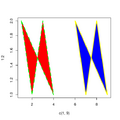
File:Polygon.png plot(c(1, 9), 1:2, type = "n") polygon(1:9, c(2,1,2,1,NA,2,1,2,1),(577 × 577 (30 KB)) - 17:31, 23 April 2024
File:Ruspini.png # ruspini is 75 x 2 op <- par(mfrow= c(3,2), oma= c(0,0, 3, 0),(1,000 × 550 (81 KB)) - 10:41, 10 August 2022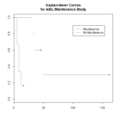
File:KMcurve.png ...leukemia.surv <- survfit(Surv(time, status) ~ x, data = aml[7:17,] ) , lty=2:3) # lty=2 is dashed, 3=dotted.(672 × 671 (6 KB)) - 16:15, 30 April 2020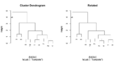
File:Dend12.png dat <- matrix(rnorm(20), ncol=2) # [1] 8 3 6 5 10 1 9 7 2 4(876 × 448 (11 KB)) - 13:17, 13 August 2023
File:Twopalette.svg par(mfrow=c(1,2), mar = c(5,2,2,1))(468 × 468 (43 KB)) - 16:09, 12 April 2019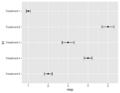
File:Geomerrorbarh.png trt = factor(c("Treatment 1", "Treatment 2", "Treatment 3", "Treatment 4", "Treatment 5")), # treatment resp = c(1, 5, 3, 4, 2), # response(516 × 400 (17 KB)) - 20:38, 15 October 2023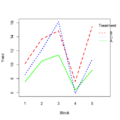
File:RbdBlock.png block_shift <- rnorm(5, mean = 0, sd = 2) treatment_shift <- c(A=0, B=4, C=2)(500 × 500 (34 KB)) - 21:51, 14 January 2023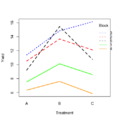
File:RbdTreat.png block_shift <- rnorm(5, mean = 0, sd = 2) treatment_shift <- c(A=0, B=4, C=2)(500 × 500 (32 KB)) - 21:50, 14 January 2023
File:Paletteheatmap.png pal <- matrix(pal, nr=2) # acknowledge a nice warning message # 2 rows, 3 columns with labeling on two axes(534 × 615 (12 KB)) - 11:14, 10 May 2023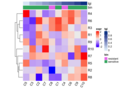
File:ComplexHeatmap1.png draw(padding = unit(c(2, 20, 2, 2), "mm"))(600 × 450 (29 KB)) - 15:02, 23 August 2022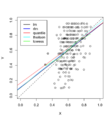
File:DataOutliers.png plot(puree[,1], puree[, 2], xlim=c(0,1), ylim=c(0,1), xlab="X", ylab="Y") abline(0,1, lty=2)(1,020 × 1,096 (172 KB)) - 15:27, 7 March 2024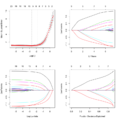
File:Glmnet4plotn.png oldpar <- par(mfrow=c(2,2))(800 × 800 (111 KB)) - 12:11, 13 April 2020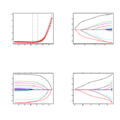
File:Glmnet4plot.svg oldpar <- par(mfrow=c(2,2))(563 × 563 (216 KB)) - 12:03, 13 April 2020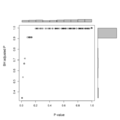
File:Scatterhist.svg zones=matrix(c(2,0,1,3), ncol=2, byrow=TRUE) mtext(ylab, side=2, line=1, outer=TRUE, adj=0,(563 × 563 (70 KB)) - 10:22, 16 February 2024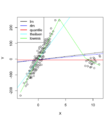
File:DataOutliers2.png plot(puree[,1], puree[, 2], xlab="X", ylab="Y") col = c("black", "blue", "red", "cyan", "green"), lty=1, lwd=2)(1,020 × 1,096 (133 KB)) - 16:49, 8 March 2024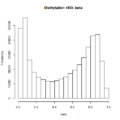
File:Methybetahist.png hist(x[, 2], xlab="beta", main="Methylation 450k beta")(480 × 480 (4 KB)) - 10:19, 30 July 2015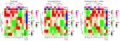
File:Rotateheatmap.png anno4 = rep(letters[1:3], c(3,3,2))), # rotate the 1st 4 columns, switch the orders of the top 2 rows(1,314 × 448 (52 KB)) - 14:44, 13 August 2023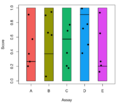
File:Jitterbox.png col = "black", lwd = 2) points(jitter(rep(i, nr), amount=.2), mat[, i], pch=16)(1,020 × 906 (50 KB)) - 22:53, 8 February 2024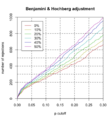
File:Filtered p.png # [2,] 0.9585758 0.9460504 0.9304104 0.9059466 0.8874485 0.8709793 apply(p_bh, 2, function(x) mean(is.na(x))) |> round(2)(1,020 × 1,096 (171 KB)) - 21:35, 11 March 2024


