Tidyverse: Difference between revisions
| (54 intermediate revisions by the same user not shown) | |||
| Line 20: | Line 20: | ||
* [http://taichimd.us/pdf/data-import.pdf Data Import] | * [http://taichimd.us/pdf/data-import.pdf Data Import] | ||
* [http://taichimd.us/pdf/data-import-cheatsheet.pdf Data Import with readr, tibble, and tidyr] (not in RStudio anymore?) | * [http://taichimd.us/pdf/data-import-cheatsheet.pdf Data Import with readr, tibble, and tidyr] (not in RStudio anymore?) | ||
== Books == | |||
[https://christianb.gumroad.com/l/tidyverse-booster?layout=profile Going from Beginner to Advanced in the Tidyverse] | |||
== Online == | == Online == | ||
| Line 53: | Line 56: | ||
== Base-R and Tidyverse == | == Base-R and Tidyverse == | ||
* [https://matloff.wordpress.com/2022/08/24/base-r-and-tidyverse-code-side-by-side/ Base-R and Tidyverse Code, Side-by-Side] | * [https://matloff.wordpress.com/2022/08/24/base-r-and-tidyverse-code-side-by-side/ Base-R and Tidyverse Code, Side-by-Side] | ||
== tidyverse vs python panda == | |||
[https://www.r-bloggers.com/2024/02/why-pandas-feels-clunky-when-coming-from-r/ Why pandas feels clunky when coming from R] | |||
= Examples = | = Examples = | ||
| Line 239: | Line 245: | ||
| [[:File:Ad public.svg]] | | [[:File:Ad public.svg]] | ||
|} | |} | ||
== palmerpenguins data == | |||
[https://www.r-bloggers.com/2023/11/introduction-to-data-manipulation-in-r-with-dplyr/ Introduction to data manipulation in R with {dplyr}] | |||
== glm() and ggplot2(), mtcars == | |||
<syntaxhighlight lang='rsplus'> | |||
data(mtcars) | |||
# Fit a Poisson regression model to predict "mpg" based on "wt" | |||
model <- mtcars %>% | |||
select(mpg, wt) %>% | |||
mutate(wt = as.numeric(wt)) %>% | |||
glm(mpg ~ wt, family = poisson(link = "log"), data = .) | |||
# Print the summary of the model | |||
summary(model) | |||
# Make predictions on new data | |||
new_data <- data.frame(wt = c(2.5, 3.0, 3.5)) | |||
predictions <- predict(model, new_data, type = "response") | |||
print(predictions) | |||
# Visualize the results with ggplot2 | |||
ggplot(data = mtcars, aes(x = wt, y = mpg)) + | |||
geom_point() + | |||
stat_smooth(method = "glm", formula = "y ~ x", | |||
method.args = list(family = poisson(link = "log")), | |||
se = FALSE, color = "red") + | |||
labs(x = "Weight", y = "Miles per gallon") | |||
</syntaxhighlight> | |||
== Opioid prescribing habits in texas == | == Opioid prescribing habits in texas == | ||
| Line 246: | Line 282: | ||
<ul> | <ul> | ||
<li>[https://dplyr.tidyverse.org/reference/case_when.html case_when()]: A general vectorised if. This function allows you to vectorise multiple if_else() statements. [https://www.sharpsightlabs.com/blog/case-when-r/ How to use the R case_when function]. | <li>[https://dplyr.tidyverse.org/reference/case_when.html case_when()]: A general vectorised if. This function allows you to vectorise multiple if_else() statements. [https://www.sharpsightlabs.com/blog/case-when-r/ How to use the R case_when function]. | ||
<pre> | |||
case_when( | |||
condition_1 ~ result_1, | |||
condition_2 ~ result_2, | |||
... | |||
condition_n ~ result_n, | |||
.default = default_result | |||
) | |||
</pre> | |||
<pre> | <pre> | ||
x %>% mutate(group = case_when( | x %>% mutate(group = case_when( | ||
| Line 280: | Line 325: | ||
1 0.908 1 | 1 0.908 1 | ||
2 0.898 1 | 2 0.898 1 | ||
... | |||
15 0.961 3 | 15 0.961 3 | ||
| Line 301: | Line 335: | ||
1 0.992 1 | 1 0.992 1 | ||
2 0.945 1 | 2 0.945 1 | ||
... | |||
15 0.864 3 | 15 0.864 3 | ||
</pre> | </pre> | ||
| Line 318: | Line 341: | ||
</ul> | </ul> | ||
* [https://www.rdocumentation.org/packages/knitr/versions/1.25/topics/kable kable()] | * [https://www.rdocumentation.org/packages/knitr/versions/1.25/topics/kable kable()] | ||
== Tidying the Freedom Index == | |||
https://pacha.dev/blog/2023/06/05/freedom-index/index.html | |||
tidyverse | |||
* gsub() | |||
* read_excel() | |||
* filter() | |||
* pivot_longer() | |||
* case_when() | |||
* fill() | |||
* group_by(), mutate(), row_number(), ungroup() | |||
* pivot_wider() | |||
* drop_na() | |||
* ungroup(), distinct() | |||
* left_join() | |||
ggplot2 | |||
* geom_line() | |||
* facet_wrap() | |||
* theme_minimal() | |||
* theme() | |||
* labs() | |||
== Useful dplyr functions (with examples) == | == Useful dplyr functions (with examples) == | ||
| Line 571: | Line 617: | ||
== Anonymous functions == | == Anonymous functions == | ||
* | * See [[R#anonymous_function|R]] page | ||
* [https://campus.datacamp.com/courses/intermediate-r/chapter-4-the-apply-family?ex=4 lapply and anonymous functions] | * [https://campus.datacamp.com/courses/intermediate-r/chapter-4-the-apply-family?ex=4 lapply and anonymous functions] | ||
== Transformation on multiple columns == | |||
* [https://datasciencetut.com/how-to-apply-a-transformation-to-multiple-columns-in-r/ How to apply a transformation to multiple columns in R?] | |||
** '''df %>% mutate(across(c(col1, col2), function(x) x*2))''' | |||
) | ** '''df %>% summarise(across(c(col1, col2), mean, na.rm=TRUE)) | ||
* select() vs '''across()''' | |||
** the across() and select() functions are both used to manipulate columns in a data frame | |||
** The select() function is used to select columns from a data frame. | |||
** The across() function is used to apply a function to multiple columns in a data frame. It’s often used inside other functions like '''mutate()''' or '''summarize()'''. | |||
:<syntaxhighlight lang='rsplus'> | |||
data.frame( | |||
x = c(1, 2, 3), | |||
y = c(4, 5, 6) | |||
) %>% | |||
mutate(across(everything(), ~ .x * 2)) # purrr-style lambda | |||
# x y | |||
#1 2 8 | |||
#2 4 10 | |||
#3 6 12 | |||
</syntaxhighlight> | |||
* [https://twitter.com/ChBurkhart/status/1655559927715463169?s=20 Quick tidyverse tip: How to make your summary statistics more human readable with pivot_wider] | |||
= Reading and writing data = | |||
[https://www.danielecook.com/speeding-up-reading-and-writing-in-r/ Speeding up Reading and Writing in R] | |||
== [https://cran.r-project.org/web/packages/data.table/index.html data.table] == | |||
Fast aggregation of large data (e.g. 100GB in RAM or just several GB size file), fast ordered joins, fast add/modify/delete of columns by group using no copies at all, list columns and a fast file reader (fread). | |||
) | |||
Note: '''data.table''' has its own ways (cf base R and '''dplyr''') to subset columns. | |||
Some resources: | |||
* https://www.rdocumentation.org/packages/data.table/versions/1.12.0 | |||
* [https://github.com/chuvanan/rdatatable-cookbook cookbook] | |||
* [https://www.waldrn.com/dplyr-vs-data-table/ R Packages: dplyr vs data.table] | |||
* [https://martinctc.github.io/blog/comparing-common-operations-in-dplyr-and-data.table/ Comparing Common Operations in dplyr and data.table] | |||
* [https://github.com/rstudio/cheatsheets/raw/master/datatable.pdf Cheat sheet] from [https://www.rstudio.com/resources/cheatsheets/ RStudio] | |||
* [https://www.r-bloggers.com/importing-data-into-r-part-two/ Reading large data tables in R]. fread(FILENAME) | |||
* Note that '''x[, 2]'' always return 2. If you want to do the thing you want, use ''x[, 2, with=FALSE]'' or ''x[, V2]'' where V2 is the header name. See the FAQ #1 in [http://datatable.r-forge.r-project.org/datatable-faq.pdf data.table]. | |||
* [http://r-norberg.blogspot.com/2016/06/understanding-datatable-rolling-joins.html Understanding data.table Rolling Joins] | |||
* [https://rollingyours.wordpress.com/2016/06/14/fast-aggregation-of-large-data-with-the-data-table-package/ Intro to The data.table Package] | |||
** Subsetting rows and/or columns | |||
** Alternative to using tapply(), aggregate(), table() to summarize data | |||
** Similarities to SQL, DT[i, j, by] | |||
* [https://www.listendata.com/2016/10/r-data-table.html R : data.table (with 50 examples)] from ListenData | |||
** Describe Data | |||
** Selecting or Keeping Columns | |||
** Rename Variables | |||
** Subsetting Rows / Filtering | |||
** Faster Data Manipulation with Indexing | |||
** Performance Comparison | |||
** Sorting Data | |||
** Adding Columns (Calculation on rows) | |||
** How to write Sub Queries (like SQL) | |||
** Summarize or Aggregate Columns | |||
** GROUP BY (Within Group Calculation) | |||
** Remove Duplicates | |||
** Extract values within a group | |||
** SQL's RANK OVER PARTITION | |||
** Cumulative SUM by GROUP | |||
** Lag and Lead | |||
Some resources: | ** Between and LIKE Operator | ||
* https://www.rdocumentation.org/packages/data.table/versions/1.12.0 | ** Merging / Joins | ||
* [https://github.com/chuvanan/rdatatable-cookbook cookbook] | ** Convert a data.table to data.frame | ||
* [https://www.waldrn.com/dplyr-vs-data-table/ R Packages: dplyr vs data.table] | * [https://www.dezyre.com/data-science-in-r-programming-tutorial/r-data-table-tutorial R Tutorial: data.table] from dezyre.com | ||
* [https://martinctc.github.io/blog/comparing-common-operations-in-dplyr-and-data.table/ Comparing Common Operations in dplyr and data.table] | ** Syntax: DT[where, select|update|do, by] | ||
* [https://github.com/rstudio/cheatsheets/raw/master/datatable.pdf Cheat sheet] from [https://www.rstudio.com/resources/cheatsheets/ RStudio] | ** Keys and setkey() | ||
* [https://www.r-bloggers.com/importing-data-into-r-part-two/ Reading large data tables in R]. fread(FILENAME) | ** Fast grouping using j and by: DT[,sum(v),by=x] | ||
* Note that '''x[, 2]'' always return 2. If you want to do the thing you want, use ''x[, 2, with=FALSE]'' or ''x[, V2]'' where V2 is the header name. See the FAQ #1 in [http://datatable.r-forge.r-project.org/datatable-faq.pdf data.table]. | ** Fast ordered joins: X[Y,roll=TRUE] | ||
* [http://r-norberg.blogspot.com/2016/06/understanding-datatable-rolling-joins.html Understanding data.table Rolling Joins] | * In the [https://cran.r-project.org/web/packages/data.table/vignettes/datatable-intro-vignette.html Introduction to data.table] vignette, the data.table::order() function is SLOWER than base::order() from my Odroid xu4 (running Ubuntu 14.04.4 trusty on uSD) <syntaxhighlight lang='rsplus'> | ||
* [https://rollingyours.wordpress.com/2016/06/14/fast-aggregation-of-large-data-with-the-data-table-package/ Intro to The data.table Package] | odt = data.table(col=sample(1e7)) | ||
** Subsetting rows and/or columns | (t1 <- system.time(ans1 <- odt[base::order(col)])) ## uses order from base R | ||
** Alternative to using tapply(), aggregate(), table() to summarize data | # user system elapsed | ||
** Similarities to SQL, DT[i, j, by] | # 2.730 0.210 2.947 | ||
* [https://www.listendata.com/2016/10/r-data-table.html R : data.table (with 50 examples)] from ListenData | (t2 <- system.time(ans2 <- odt[order(col)])) ## uses data.table's order | ||
** Describe Data | # user system elapsed | ||
** Selecting or Keeping Columns | # 2.830 0.215 3.052 | ||
** Rename Variables | (identical(ans1, ans2)) | ||
** Subsetting Rows / Filtering | # [1] TRUE | ||
** Faster Data Manipulation with Indexing | </syntaxhighlight> | ||
** Performance Comparison | * [https://jangorecki.github.io/blog/2016-06-30/Boost-Your-Data-Munging-with-R.html Boost Your Data Munging with R] | ||
** Sorting Data | * [https://www.rdocumentation.org/packages/data.table/versions/1.12.0/topics/rbindlist rbindlist()]. One problem, it uses too much memory. In fact, when I try to analyze R package downloads, the command "dat <- rbindlist(logs)" uses up my 64GB memory (OS becomes unresponsive). | ||
** Adding Columns (Calculation on rows) | * [https://github.com/Rdatatable/data.table/wiki/Convenience-features-of-fread Convenience features of fread] | ||
** How to write Sub Queries (like SQL) | * [https://www.infoworld.com/article/3575086/the-ultimate-r-datatable-cheat-sheet.html?s=09 The ultimate R data.table cheat sheet] from infoworld | ||
** Summarize or Aggregate Columns | |||
** GROUP BY (Within Group Calculation) | [https://github.com/Rdatatable/data.table/wiki/Installation#openmp-enabled-compiler-for-mac OpenMP enabled compiler for Mac]. This instruction works on my Mac El Capitan (10.11.6) when I need to upgrade the data.table version from 1.11.4 to 1.11.6. | ||
** Remove Duplicates | |||
** Extract values within a group | Question: how to make use multicore with data.table package? | ||
** SQL's RANK OVER PARTITION | |||
** Cumulative SUM by GROUP | === dtplyr === | ||
** Lag and Lead | https://www.tidyverse.org/blog/2019/11/dtplyr-1-0-0/ | ||
** Between and LIKE Operator | |||
** Merging / Joins | = reshape & reshape2 (superceded by tidyr package) = | ||
** Convert a data.table to data.frame | * [http://r-exercises.com/2016/07/06/data-shape-transformation-with-reshape/ Data Shape Transformation With Reshape()] | ||
* [https://www.dezyre.com/data-science-in-r-programming-tutorial/r-data-table-tutorial R Tutorial: data.table] from dezyre.com | * Use '''acast()''' function in reshape2 package. It will convert data.frame used for analysis to a table-like data.frame good for display. | ||
** Syntax: DT[where, select|update|do, by] | * http://lamages.blogspot.com/2013/10/creating-matrix-from-long-dataframe.html | ||
** Keys and setkey() | |||
** Fast grouping using j and by: DT[,sum(v),by=x] | |||
** Fast ordered joins: X[Y,roll=TRUE] | |||
* In the [https://cran.r-project.org/web/packages/data.table/vignettes/datatable-intro-vignette.html Introduction to data.table] vignette, the data.table::order() function is SLOWER than base::order() from my Odroid xu4 (running Ubuntu 14.04.4 trusty on uSD) <syntaxhighlight lang='rsplus'> | |||
odt = data.table(col=sample(1e7)) | |||
(t1 <- system.time(ans1 <- odt[base::order(col)])) ## uses order from base R | |||
# user system elapsed | |||
# 2.730 0.210 2.947 | |||
(t2 <- system.time(ans2 <- odt[order(col)])) ## uses data.table's order | |||
# user system elapsed | |||
# 2.830 0.215 3.052 | |||
(identical(ans1, ans2)) | |||
# [1] TRUE | |||
</syntaxhighlight> | |||
* [https://jangorecki.github.io/blog/2016-06-30/Boost-Your-Data-Munging-with-R.html Boost Your Data Munging with R] | |||
* [https://www.rdocumentation.org/packages/data.table/versions/1.12.0/topics/rbindlist rbindlist()]. One problem, it uses too much memory. In fact, when I try to analyze R package downloads, the command "dat <- rbindlist(logs)" uses up my 64GB memory (OS becomes unresponsive). | |||
* [https://github.com/Rdatatable/data.table/wiki/Convenience-features-of-fread Convenience features of fread] | |||
* [https://www.infoworld.com/article/3575086/the-ultimate-r-datatable-cheat-sheet.html?s=09 The ultimate R data.table cheat sheet] from infoworld | |||
[ | = [http://cran.r-project.org/web/packages/tidyr/index.html tidyr] = | ||
== Missing values == | |||
[https://www.programmingwithr.com/handling-missing-values-in-r-using-tidyr/ Handling Missing Values in R using tidyr] | |||
== Pivot == | |||
<ul> | |||
<li>tidyr package. [https://tidyr.tidyverse.org/articles/pivot.html pivot vignette], | |||
[https://tidyr.tidyverse.org/reference/pivot_wider.html pivot_wider()] | |||
== Pivot == | |||
<ul> | |||
<li>[https://tidyr.tidyverse.org/articles/pivot.html pivot vignette] | |||
[https://tidyr.tidyverse.org/reference/pivot_wider.html pivot_wider()] | |||
<pre> | <pre> | ||
R> d2 <- tibble(o=rep(LETTERS[1:2], each=3), n=rep(letters[1:3], 2), v=1:6); d2 | R> d2 <- tibble(o=rep(LETTERS[1:2], each=3), n=rep(letters[1:3], 2), v=1:6); d2 | ||
| Line 743: | Line 760: | ||
</ul> | </ul> | ||
</li> | </li> | ||
<li>Conversion from gather() to | <li>Conversion from gather() to pivot_longer() | ||
<pre> | <pre> | ||
gather(df, key=KeyName, value = valueName, col1, col2, ...) # No quotes around KeyName and valueName | gather(df, key=KeyName, value = valueName, col1, col2, ...) # No quotes around KeyName and valueName | ||
pivot_longer(df, cols, names_to = "keyName", values_to = "valueName") | |||
# cols can be everything() | |||
# cols can be numerical numbers or column names | |||
</pre> | </pre> | ||
</li> | </li> | ||
| Line 838: | Line 857: | ||
</syntaxhighlight> | </syntaxhighlight> | ||
* [http://genomicsclass.github.io/book/pages/dplyr_tutorial.html dplyr tutorial] from PH525x series (Biomedical Data Science by Rafael Irizarry and Michael Love). For select() function, some additional options to select columns based on a specific criteria include | * [http://genomicsclass.github.io/book/pages/dplyr_tutorial.html dplyr tutorial] from PH525x series (Biomedical Data Science by Rafael Irizarry and Michael Love). For select() function, some additional options to select columns based on a specific criteria include | ||
** | ** [https://tidyselect.r-lib.org/reference/starts_with.html starts_with()]/ ends_with() = Select columns that start/end with a character string | ||
** contains() = Select columns that contain a character string | ** contains() = Select columns that contain a character string | ||
** matches() = Select columns that match a regular expression | ** matches() = Select columns that match a regular expression | ||
| Line 900: | Line 919: | ||
group_by(year, month, day) %>% | group_by(year, month, day) %>% | ||
summarise(mean = mean(dep_delay, na.rm = TRUE)) | summarise(mean = mean(dep_delay, na.rm = TRUE)) | ||
</syntaxhighlight> | |||
* Another example | |||
:<syntaxhighlight lang='r'> | |||
data <- data.frame( | |||
name = c("Alice", "Bob", "Charlie", "David", "Eve"), | |||
age = c(25, 30, 35, 40, 45), | |||
gender = c("F", "M", "M", "M", "F"), | |||
score1 = c(80, 85, 90, 95, 100), | |||
score2 = c(75, 80, 85, 90, 95) | |||
) | |||
# Example usage of dplyr functions | |||
result <- data %>% | |||
filter(gender == "M") %>% # Keep only rows where gender is "M" | |||
select(name, age, score1) %>% # Select specific columns | |||
mutate(score_diff = score1 - score2) %>% # Calculate a new column based on existing columns | |||
arrange(desc(age)) %>% # Arrange rows in descending order of age | |||
#group_by(gender) %>% # Group the data by gender | |||
summarize(mean_score1 = mean(score1)) # Calculate the mean of score1 for each group | |||
</syntaxhighlight> | </syntaxhighlight> | ||
* [https://csgillespie.github.io/efficientR/data-carpentry.html#dplyr Efficient R Programming] | * [https://csgillespie.github.io/efficientR/data-carpentry.html#dplyr Efficient R Programming] | ||
| Line 917: | Line 955: | ||
* [https://towardsdatascience.com/what-you-need-to-know-about-the-new-dplyr-1-0-0-7eaaaf6d78ac The Seven Key Things You Need To Know About dplyr 1.0.0] | * [https://towardsdatascience.com/what-you-need-to-know-about-the-new-dplyr-1-0-0-7eaaaf6d78ac The Seven Key Things You Need To Know About dplyr 1.0.0] | ||
== select() for columns == | |||
== select() == | |||
[https://www.quantargo.com/courses/course-r-introduction/03-dplyr/02-select-columns-data-frame/recipe Select columns from a data frame] | [https://www.quantargo.com/courses/course-r-introduction/03-dplyr/02-select-columns-data-frame/recipe Select columns from a data frame] | ||
<pre> | <pre> | ||
| Line 937: | Line 972: | ||
</pre> | </pre> | ||
== | === .$Name === | ||
Extract a column using piping. The '''.''' represents the data frame that is being piped in, and $Name extracts the ‘Name’ column. | |||
<pre> | |||
mtcars %>% .$mpg # A vector | |||
mtcars %>% select(mpg) # A list | |||
</pre> | |||
== filter() for rows == | |||
<pre> | <pre> | ||
mtcars %>% filter(mpg>10) | |||
identical(mtcars %>% filter(mpg>10), subset(mtcars, mpg>10)) | |||
# [1] TRUE | |||
</pre> | </pre> | ||
=== | === filter by date === | ||
[https://datasciencetut.com/ | [https://datasciencetut.com/what-is-the-best-way-to-filter-by-date-in-r/ What Is the Best Way to Filter by Date in R?] | ||
== | == arrange (reorder) == | ||
<ul> | |||
<li>Arrange values by a Single Variable: | |||
<pre> | <pre> | ||
# Create a sample data frame | |||
students <- data.frame( | |||
Name = c("Ali", "Boby", "Charlie", "Davdas"), | |||
Score = c(85, 92, 78, 95) | |||
) | |||
# Arrange by Score in ascending order | |||
arrange(students, Score) | |||
# Name Score | |||
# 1 Charlie 78 | |||
# 2 Ali 85 | |||
# 3 Boby 92 | |||
# 4 Davdas 95 | |||
</pre> | </pre> | ||
<li>Arrange values by Multiple Variables: | |||
This is like the "sort" function in Excel. | |||
<pre> | |||
# Create a sample data frame | |||
transactions <- data.frame( | |||
Date = c("2024-04-01", "2024-04-01", "2024-04-02", "2024-04-03"), | |||
Amount = c(100, 150, 200, 75) | |||
) | |||
# Arrange by Date in ascending order, then by Amount in descending order | |||
arrange(transactions, Date, desc(Amount)) | |||
# Date Amount | |||
# 1 2024-04-01 150 | |||
# 2 2024-04-01 100 | |||
# 3 2024-04-02 200 | |||
# 4 2024-04-03 75 | |||
</pre> | |||
<li>Arrange values with Missing Values: | |||
<pre> | |||
# Create a sample data frame with missing values | |||
data <- data.frame( | |||
ID = c(1, 2, NA, 4), | |||
Value = c(20, NA, 15, 30) | |||
) | |||
# Arrange by Value in ascending order, placing missing values first | |||
arrange(data, desc(is.na(Value)), Value) | |||
# ID Value | |||
# 1 2 NA | |||
# 2 NA 15 | |||
# 3 1 20 | |||
# 4 4 30 | |||
</pre> | |||
</ul> | |||
=== | === arrange and match === | ||
[ | How to do the following in pipe ''' A <- A[match(id.ref, A$id), ]''' | ||
[https://stackoverflow.com/a/52216391 How to sort rows of a data frame based on a vector using dplyr pipe], [https://stackoverflow.com/a/59730594 Order data frame rows according to vector with specific order] | |||
<ul> | <ul> | ||
<li>[ | <li>Data | ||
<syntaxhighlight lang=' | <syntaxhighlight lang='r'> | ||
library(dplyr) | |||
# | |||
# Create a sample dataframe 'A' | |||
set.seed(1); A <- data.frame( | |||
id = sample(letters[1:5]), | |||
value = 1:5 | |||
) | |||
print(A) | |||
id value | |||
1 a 1 | |||
2 d 2 | |||
3 c 3 | |||
4 e 4 | |||
5 b 5 | |||
# Create a reference vector 'id.ref' | |||
id.ref <- c("e", "d", "c", "b", "a") | |||
</syntaxhighlight> | |||
<syntaxhighlight lang='r'> | |||
# Goal: | |||
A[match(id.ref, A$id),] | |||
id value | |||
4 e 4 | |||
2 d 2 | |||
3 c 3 | |||
5 b 5 | |||
1 a 1 | |||
</syntaxhighlight> | |||
<li>Method 1 (best): no match() is needed. Brilliant! | |||
<syntaxhighlight lang='r'> | |||
A %>% arrange(factor(id, levels=id.ref)) | |||
id value | |||
1 e 4 | |||
2 d 2 | |||
3 c 3 | |||
4 b 5 | |||
5 a 1 | |||
# detail: | |||
factor(A$id, levels=id.ref) | |||
[1] a d c e b | |||
Levels: e d c b a | |||
</syntaxhighlight> | |||
<li>Method 2: complicated | |||
<syntaxhighlight lang='r'> | |||
A %>% | |||
mutate(id.match = match(id, id.ref)) %>% | |||
arrange(id.match) %>% | |||
select(-id.match) | |||
id value | |||
1 e 4 | |||
2 d 2 | |||
3 c 3 | |||
4 b 5 | |||
5 a 1 | |||
# detail: | |||
A %>% | |||
mutate(id.match = match(id, id.ref)) | |||
id value id.match | |||
1 a 1 5 | |||
2 d 2 2 | |||
3 c 3 3 | |||
4 e 4 1 | |||
5 b 5 4 | |||
</syntaxhighlight> | </syntaxhighlight> | ||
<li>Method 3: a simplified version of Method 2, but it needs match() | |||
<syntaxhighlight lang='r'> | |||
A %>% arrange(match(id, id.ref)) | |||
id value | |||
1 e 4 | |||
2 d 2 | |||
3 c 3 | |||
4 b 5 | |||
5 a 1 | |||
</syntaxhighlight> | |||
</ul> | |||
== group_by() == | |||
* [https://dplyr.tidyverse.org/reference/group_by.html ?group_by] and ungroup(), | |||
* [https://dplyr.tidyverse.org/articles/grouping.html Grouped data] | |||
* Is ungroup() recommended after every group_by()? Always ungroup() when you’ve finished with your calculations. See [https://bookdown.org/yih_huynh/Guide-to-R-Book/groupby.html#ungrouping here] or [https://community.rstudio.com/t/is-ungroup-recommended-after-every-group-by/5296 this]. | |||
* You might want to use ungroup() if you want to perform further calculations or manipulations on the data that don’t depend on the grouping. For example, after ungrouping the data, you could add new columns or filter rows without being restricted by the grouping. | |||
<pre> | |||
+-- mutate() + ungroup() | |||
x -- group_by() --| | |||
+-- summarise() # reduce the dimension, no way to get back | |||
</pre> | |||
=== Subset rows by group === | |||
[https://datasciencetut.com/subset-rows-based-on-their-integer-locations/ Subset rows based on their integer locations-slice in R] | |||
=== Rank by Group === | |||
[https://datasciencetut.com/how-to-rank-by-group-in-r/ How to Rank by Group in R?] | |||
<pre> | |||
df %>% arrange(team, points) %>% | |||
group_by(team) %>% | |||
mutate(rank = rank(points)) | |||
</pre> | |||
=== group_by() + summarise(), arrange(desc()) === | |||
[https://r4ds.had.co.nz/transform.html Data transformation] from R for Data Science | |||
[https://www.guru99.com/r-aggregate-function.html#3 Function in summarise()] | |||
* group_by(var1) %>% summarise(varY = mean(var2)) %>% ggplot(aes(x = varX, y = varY, fill = varF)) + geom_bar(stat = "identity") + theme_classic() | |||
* summarise(newvar = sum(var1) / sum(var2)) | |||
* arrange(desc(var1, var2)) | |||
* Distinct number of observation: '''n_distinct()''' | |||
* Count the number of rows: '''n()''' | |||
* nth observation of the group: '''nth()''' | |||
* First observation of the group: '''first()''' | |||
* Last observation of the group: '''last()''' | |||
== | === group_by() + summarise() + across() === | ||
[https:// | * [https://twitter.com/ChBurkhart/status/1647243881095000069?s=20 Get a summarize from multiple columns without explicitly specifying the column names] | ||
* [https://dplyr.tidyverse.org/reference/across.html ?across] | |||
== | === group_by() + nest(), mutate(, map()), unnest(), list-columns === | ||
[https://www.rdocumentation.org/packages/tidyr/versions/1.3.0/topics/nest nest(data=)] is a function in the tidyr package in R that allows you to create nested data frames, where '''one column contains another data frame or list'''. This is useful when you want to perform analysis or visualization on each group separately. '''PS:''' it seems group_by() is not needed. | |||
:<syntaxhighlight lang='rsplus'> | |||
histogram <- gss_cat |> | |||
nest(data = -marital) |> # OR nest(.by = marital). 6x2 tibble. Col1=marital, col2=data. | |||
mutate( | |||
histogram = pmap( | |||
.l = list(marital, data), | |||
.f = \(marital, data) { | |||
ggplot(data, aes(x = tvhours)) + | |||
geom_histogram(binwidth = 1) + | |||
labs( | |||
title = marital | |||
) | |||
} | |||
) | |||
) | |||
histogram$histogram[[1]] | |||
</syntaxhighlight> | |||
[https://r4ds.had.co.nz/many-models.html Many models] from R for Data Science | |||
[https:// | |||
<ul> | <ul> | ||
<li> | <li>[https://tidyr.tidyverse.org/reference/nest.html ?unnest], vignette('rectangle'), vignette('nest') & vignette('pivot') | ||
<li>[https://stackoverflow.com/a/ | <syntaxhighlight lang='rsplus'> | ||
tibble(x = 1:2, y = list(1:4, 2:3)) %>% unnest(y) %>% group_by(x) %>% nest() | |||
# returns to tibble(x = 1:2, y = list(1:4, 2:3)) with 'groups' information | |||
</syntaxhighlight> | |||
</li> | |||
<li>[https://stackoverflow.com/a/38021139 annotate boxplot in ggplot2] </li> | |||
<li>[https://towardsdatascience.com/coding-in-r-nest-and-map-your-way-to-efficient-code-4e44ba58ee4a Coding in R: Nest and map your way to efficient code] | |||
<pre> | <pre> | ||
group_by() + nest() mutate(, map()) unnest() | |||
data --------------------> ---------------> -------> | |||
</pre> | </pre> | ||
< | <syntaxhighlight lang='rsplus'> | ||
install.packages('gapminder'); library(gapminder) | |||
gapminder_nest <- gapminder %>% | |||
group_by(country) %>% | |||
nest() # country, data | |||
# each row of 'data' is a tibble | |||
gapminder_nest$data[[1]] # tibble 57 x 8 | |||
x | |||
gapminder_nest <- gapminder_nest %>% | |||
mutate(pop_mean = map(.x = data, ~mean(.x$pop, na.rm = T))) | |||
# country, data, pop_mean | |||
# | gapminder_nest %>% unnest(pop_mean) # country, data, pop_mean | ||
== | gapminder_plot <- gapminder_nest %>% | ||
unnest(pop_mean) %>% | |||
select(country, pop_mean) %>% | |||
ungroup() %>% | |||
top_n(pop_mean, n = -10) %>% | |||
mutate(pop_mean = pop_mean/10^3) | |||
gapminder_plot %>% | |||
ggplot(aes(x = reorder(country, pop_mean), y = pop_mean)) + | |||
geom_point(colour = "#FF6699", size = 5) + | |||
geom_segment(aes(xend = country, yend = 0), colour = "#FF6699") + | |||
geom_text(aes(label = round(pop_mean, 0)), hjust = -1) + | |||
theme_minimal() + | |||
labs(title = "Countries with smallest mean population from 1960 to 2016", | |||
subtitle = "(thousands)", | |||
x = "", | |||
y = "") + | |||
theme(legend.position = "none", | |||
axis.text.x = element_blank(), | |||
plot.title = element_text(size = 14, face = "bold"), | |||
panel.grid.major.y = element_blank()) + | |||
coord_flip() + | |||
scale_y_continuous() | |||
</syntaxhighlight> | |||
</li> | |||
<li>[https://www.tidymodels.org/learn/statistics/tidy-analysis/ Tidy analysis] from tidymodels </li> | |||
<li>[https://community.rstudio.com/t/is-nest-mutate-map-unnest-really-the-best-alternative-to-dplyr-do/11009 Is nest() + mutate() + map() + unnest() really the best alternative to dplyr::do()] </li> | |||
</ul> | |||
== | == across() == | ||
<ul> | |||
<li>[https://dplyr.tidyverse.org/reference/across.html ?across]. Applying a function or operation to multiple columns in a data frame simultaneously. | |||
<pre> | |||
across(.cols, .fns, ..., .names = NULL, .unpack = FALSE) | |||
gdf <- | |||
tibble(g = c(1, 1, 2, 3), v1 = 10:13, v2 = 20:23) %>% | |||
group_by(g) | |||
gdf %>% mutate(across(v1:v2, ~ .x + rnorm(1))) | |||
* [https:// | #> g v1 v2 | ||
#> <dbl> <dbl> <dbl> | |||
#> 1 1 10.3 20.7 | |||
#> 2 1 11.3 21.7 | |||
#> 3 2 11.2 22.6 | |||
#> 4 3 13.5 22.7 | |||
</pre> | |||
<li>[https://www.infoworld.com/article/3537612/dplyr-across-first-look-at-a-new-tidyverse-function.html dplyr across: First look at a new Tidyverse function]. | |||
* [https://dplyr.tidyverse.org/reference/across.html Apply a function (or functions) across multiple columns]. across(), if_any(), if_all(). | |||
* [https://tidyselect.r-lib.org/reference/starts_with.html Select variables that match a pattern]. starts_with(), ends_with(), contains(), matches(), num_range(). | |||
* [https://twitter.com/romain_francois/status/1350078666554933249/photo/2 data %>% group_by(Var1) %>% summarise(across(contains("SomeKey"), mean, na.rm = TRUE))] | |||
<syntaxhighlight lang='rsplus'> | |||
ny <- filter(cases, State == "NY") %>% | |||
select(County = `County Name`, starts_with(c("3", "4"))) | |||
daily_totals <- ny %>% | |||
summarize( | |||
across(starts_with("4"), sum) | |||
) | |||
median_and_max <- list( | |||
med = ~median(.x, na.rm = TRUE), | |||
max = ~max(.x, na.rm = TRUE) | |||
) | |||
april_median_and_max <- ny %>% | |||
summarize( | |||
<pre> | across(starts_with("4"), median_and_max) | ||
) | |||
</pre> | |||
<pre> | |||
# across(.cols = everything(), .fns = NULL, ..., .names = NULL) | |||
# Rounding the columns Sepal.Length and Sepal.Width | |||
iris %>% | |||
as_tibble() %>% | |||
mutate(across(c(Sepal.Length, Sepal.Width), round)) | |||
iris %>% summarise(across(contains("Sepal"), ~mean(.x, na.rm = TRUE))) | |||
# filter rows | |||
iris %>% filter(if_any(ends_with("Width"), ~ . > 4)) | |||
iris %>% select(starts_with("Sepal")) | |||
iris %>% select(starts_with(c("Petal", "Sepal"))) | |||
iris %>% select(contains("Sepal")) | |||
</syntaxhighlight> | |||
</ul> | |||
== ave() - Adding a column of means by group to original data == | |||
* [https://stackoverflow.com/a/7976250 Adding a column of means by group to original data], | |||
* [https://stackoverflow.com/a/6057297 ave(, FUN) for any function instead of average] | |||
= | == mutate vs tapply == | ||
[https://matloff.wordpress.com/2022/08/06/base-r-is-alive-and-well/ Base-R is alive and well] | |||
== mutate + replace() or ifelse() == | |||
<ul> | |||
</ | <li>mutate() is similar to [https://stat.ethz.ch/R-manual/R-devel/library/base/html/with.html base::within()] </li> | ||
<li>[https://stackoverflow.com/a/28013895 Change value of variable with dplyr] | |||
: < | <pre> | ||
mtcars %>% | |||
mutate(mpg=replace(mpg, cyl==4, NA)) %>% | |||
as.data.frame() | |||
# VS | |||
mtcars$mpg[mtcars$cyl == 4] <- NA | |||
</pre> | |||
</li> | |||
<li>[https://stackoverflow.com/a/35610521 using ifelse()] </li> | |||
<li>[https://stackoverflow.com/a/61602568 using case_when()] </li> | |||
<li>[https://dplyr.tidyverse.org/reference/mutate_all.html Mutate multiple columns] </li> | |||
</ | <li>[https://www.bioinfoblog.com/entry/tidydata/advancedmutate Apply the mutate function to multiple columns at once | mutate_at / mutate_all / mutate_if] | ||
<pre> | |||
: | mutate_at(data, .vars = vars(starts_with("Petal")), .funs = ~ . * 2) %>% head() | ||
mutate_at(data, .vars = vars(starts_with("Petal")), `*`, 2) %>% head() | |||
</pre> | |||
</li> | |||
<li>[https://dplyr.tidyverse.org/reference/recode.html recode()] | |||
<pre> | |||
char_vec <- sample(c("a", "b", "c"), 10, replace = TRUE) | |||
recode(char_vec, a = "Apple", b = "Banana", .default = NA_character_) | |||
</pre> | |||
</li> | |||
</ul> | |||
== Hash table == | |||
<ul> | |||
<li>[https://stackoverflow.com/a/7659297 Create new column based on 4 values in another column]. The trick is to create a named vector; like a [https://www.geeksforgeeks.org/python-dictionary/# Dictionary in Python]. | |||
Here is my example: | |||
<syntaxhighlight lang='rsplus'> | |||
hashtable <- data.frame(value=1:4, key=c("B", "C", "A", "D")) | |||
input <- c("A", "B", "C", "D", "B", "B", "A", "A") # input to be matched with keys, | |||
# this could be very long | |||
# Trick: convert the hash table into a named vector | |||
htb <- hashtable$value; names(htb) <- hashtable$key | |||
# return the values according to the names | |||
out <- htb[input]; out | |||
A B C D B B A A | |||
3 1 2 4 1 1 3 3 | |||
</syntaxhighlight> | |||
We can implement using Python by creating a variable of [https://www.w3schools.com/python/python_dictionaries.asp dictionary type/structure]. | |||
<syntaxhighlight lang='python'> | |||
hashtable = {'B': 1, 'C': 2, 'A': 3, 'D': 4} | |||
input = ['A', 'B', 'C', 'D', 'B', 'B', 'A', 'A'] | |||
out = [hashtable[key] for key in input] | |||
</syntaxhighlight> | </syntaxhighlight> | ||
Or using C | |||
<syntaxhighlight lang='c'> | |||
#include <stdio.h> | |||
int main() { | |||
int hashtable[4] = {3, 1, 2, 4}; | |||
char input[] = {'A', 'B', 'C', 'D', 'B', 'B', 'A', 'A'}; | |||
int out[sizeof(input)/sizeof(input[0])]; | |||
for (int i = 0; i < sizeof(input)/sizeof(input[0]); i++) { | |||
out[i] = hashtable[input[i] - 'A']; | |||
} | |||
for (int i = 0; i < sizeof(out)/sizeof(out[0]); i++) { | |||
printf("%d ", out[i]); | |||
} | |||
printf("\n"); | |||
return 0; | |||
} | } | ||
</syntaxhighlight> | </syntaxhighlight> | ||
<li>[https://cran.r-project.org/web/packages/hash/index.html hash] package | |||
<li>[https://cran.r-project.org/web/packages/digest/ digest] package | |||
</ul> | |||
== inner_join, left_join, full_join == | |||
* [https://dplyr.tidyverse.org/reference/mutate-joins.html Mutating joins] | |||
* [https://statisticsglobe.com/r-dplyr-join-inner-left-right-full-semi-anti Join Data Frames with the R dplyr Package (9 Examples)] | |||
* [https://www.datasciencemadesimple.com/join-in-r-merge-in-r/ Join in r: how to join (merge) data frames (inner, outer, left, right) in R] | |||
* [https://www.guru99.com/r-dplyr-tutorial.html Dplyr Tutorial: Merge and Join Data in R with Examples] | |||
== plyr::rbind.fill() == | |||
* https://www.rdocumentation.org/packages/plyr/versions/1.8.6/topics/rbind.fill | |||
* [https://f1000research.com/articles/5-1542 An example usage] | |||
== Videos == | |||
* [https://youtu.be/jWjqLW-u3hc Hands-on dplyr tutorial for faster data manipulation in R] by Data School. At time 17:00, it compares the '''%>%''' operator, '''with()''' and '''aggregate()''' for finding group mean. | |||
* https://youtu.be/aywFompr1F4 (shorter video) by Roger Peng | |||
* https://youtu.be/8SGif63VW6E by Hadley Wickham | |||
* [https://www.rstudio.com/resources/videos/tidy-eval-programming-with-dplyr-tidyr-and-ggplot2/ Tidy eval: Programming with dplyr, tidyr, and ggplot2]. Bang bang "!!" operator was introduced for use in a function call. | |||
* JULIA SILGE | |||
** [https://juliasilge.com/blog/tuition-resampling/ Preprocessing and resampling using #tidytuesday college data] | |||
** [https://juliasilge.com/blog/beer-production/ Bootstrap resampling with #tidytuesday beer production data] | |||
* [https://www.infoworld.com/article/3411819/do-more-with-r-video-tutorials.html “Do More with R” video tutorials] by Sharon Machlis | |||
* [https://www.lynda.com/R-tutorials/Learning-R-Tidyverse/586672-2.html Learning the R Tidyverse] from lynda.com | |||
== dbplyr == | |||
* https://dbplyr.tidyverse.org/articles/dbplyr.html | |||
* [https://dbplyr.tidyverse.org/reference/translate_sql.html translate_sql()] Translate an R expression to sql. [https://twitter.com/rfunctionaday/status/1452127344093708295 Some examples]. | |||
* [https:// | |||
= stringr = | |||
<ul> | |||
<li>stringr is part of the tidyverse but is not a core package. You need to load it separately. | |||
* | <li>[http://gastonsanchez.com/blog/resources/how-to/2013/09/22/Handling-and-Processing-Strings-in-R.html Handling Strings with R](ebook) by Gaston Sanchez. | ||
* | <li>https://www.rstudio.com/wp-content/uploads/2016/09/RegExCheatsheet.pdf | ||
* | <li>[https://github.com/rstudio/cheatsheets/raw/master/strings.pdf stringr Cheat sheet] (2 pages, this will immediately download the pdf file) | ||
* | * Detect Matches: '''str_detect()''', str_which(), str_count(), str_locate() | ||
* Subset: '''str_sub()''', str_subset(), str_extract(), str_match() | |||
* Manage Lengths: str_length(), str_pad(), str_trunc(), '''str_trim()''' | |||
* Mutate Strings: '''str_sub()''', '''str_replace()''', str_replace_all(), '''str_remove()''' | |||
** Case Conversion: str_to_lower(), str_to_upper(), str_to_title() | |||
* Joint and Split: str_c(), str_dup(), str_split_fixed(), str_glue(), str_glue_date() | |||
<li>[https://csgillespie.github.io/efficientR/data-carpentry.html#regular-expressions Efficient data carpentry → Regular expressions] from Efficient R programming book by Gillespie & Lovelace. | |||
<li>Common functions: | |||
{| class="wikitable" | |||
|- | |||
! `stringr` Function !! Description !! Base R Equivalent | |||
|- | |||
| `str_length()` || Returns the number of characters in each element of a character vector. || `nchar()` | |||
|- | |||
| `str_sub()` || Extracts substrings from a character vector. || `substr()` | |||
|- | |||
| `str_trim()` || Removes leading and trailing whitespace from strings. || `trimws()` | |||
|- | |||
| `str_split()` || Splits a string into pieces based on a delimiter. || `strsplit()` | |||
|- | |||
| `str_replace()` || Replaces occurrences of a pattern in a string with another string. || `gsub()` | |||
|- | |||
| `str_detect()` || Detects whether a pattern is present in each element of a character vector. || `grepl()` | |||
|- | |||
| `str_subset()` || Returns the elements of a character vector that contain a pattern. || `grep()` | |||
|- | |||
| `str_count()` || Counts the number of occurrences of a pattern in each element of a character vector. || `gregexpr()` and `lengths()` | |||
|} | |||
</ul> | |||
== str_replace() == | |||
[https://datasciencetut.com/how-to-replace-string-in-column-in-r/ Replace a string in a column]: [https://dplyr.tidyverse.org/reference/across.html dplyr::across()] & str_replace() | |||
<pre> | |||
df <- data.frame(country=c('India', 'USA', 'CHINA', 'Algeria'), | |||
position=c('1', '1', '2', '3'), | |||
points=c(22, 25, 29, 13)) | |||
df %>% | |||
mutate(across('country', str_replace, 'India', 'Albania')) | |||
df %>% | |||
mutate(across('country', str_replace, 'A|I', '')) | |||
</pre> | </pre> | ||
== split == | |||
[https://statisticsglobe.com/split-data-frame-variable-into-multiple-columns-in-r Split Data Frame Variable into Multiple Columns in R (3 Examples)] | |||
Three ways: | |||
* base::strsplit(x, CHAR) | |||
* [https://stringr.tidyverse.org/reference/str_split.html stringr::str_split_fixed(x, CHAR, 2)] | |||
* [https://tidyr.tidyverse.org/reference/separate.html tidyr::separate(x, c("NewVar1", "NewVar2"), CHAR)] | |||
<pre> | <pre> | ||
x <- c("a-1", "b-2", "c-3") | |||
stringr::str_split_fixed(x, "-", 2) | |||
# [1] | # [,1] [,2] | ||
# [1,] "a" "1" | |||
# [2,] "b" "2" | |||
# [3,] "c" "3" | |||
tidyr::separate(data.frame(x), x, c('x1', 'x2'), "-") | |||
# The first argument must be a data frame | |||
# The 2nd argument is the column names | |||
# x1 x2 | |||
# 1 a 1 | |||
# 2 b 2 | |||
# 3 c 3 | |||
</pre> | </pre> | ||
== | = [https://github.com/smbache/magrittr magrittr]: pipe = | ||
* [https://cran.r-project.org/web/packages/magrittr/vignettes/magrittr.html Vignettes] | |||
< | ** [https://www.tidyverse.org/blog/2020/08/magrittr-2-0/?s=09 magrittr 2.0 is coming soon], [https://www.tidyverse.org/blog/2020/11/magrittr-2-0-is-here/?s=09 magrittr 2.0 is here!] | ||
* [https://thomasadventure.blog/posts/how-does-the-pipe-operator-actually-work/ How does the pipe operator actually work?] | |||
# | * [http://www.win-vector.com/blog/2018/04/magrittr-and-wrapr-pipes-in-r-an-examination/ magrittr and wrapr Pipes in R, an Examination]. Instead of nested statements, it is using pipe operator '''%>%'''. So the code is easier to read. Impressive! | ||
# | : <syntaxhighlight lang='rsplus'> | ||
x %>% f # f(x) | |||
x %>% f(y) # f(x, y) | |||
x %>% f(arg=y) # f(x, arg=y) | |||
x %>% f(z, .) # f(z, x) | |||
x %>% f(y) %>% g(z) # g(f(x, y), z) | |||
x %>% select(which(colSums(!is.na(.))>0)) # remove columns with all missing data | |||
x %>% select(which(colSums(!is.na(.))>0)) %>% filter((rowSums(!is.na(.))>0)) # remove all-NA columns _and_ rows | |||
</syntaxhighlight> | |||
</ | * [http://www.win-vector.com/blog/2018/03/r-tip-make-arguments-explicit-in-magrittr-dplyr-pipelines/ Make Arguments Explicit in magrittr/dplyr Pipelines] | ||
: <syntaxhighlight lang='rsplus'> | |||
suppressPackageStartupMessages(library("dplyr")) | |||
starwars %>% | |||
filter(., height > 200) %>% | |||
select(., height, mass) %>% | |||
head(.) | |||
# instead of | |||
starwars %>% | |||
filter(height > 200) %>% | |||
select(height, mass) %>% | |||
head | |||
</syntaxhighlight> | |||
* [https://stackoverflow.com/questions/27100678/how-to-extract-subset-an-element-from-a-list-with-the-magrittr-pipe Subset an element from a list] | |||
: <syntaxhighlight lang='rsplus'> | |||
iris$Species | |||
iris[["Species"]] | |||
iris %>% | |||
`[[`("Species") | |||
iris %>% | |||
[ | `[[`(5) | ||
= | iris %>% | ||
'' | subset(select = "Species") | ||
</syntaxhighlight> | |||
* '''Split-apply-combine''': group + summarize + sort/arrange + top n. The following example is from [https://csgillespie.github.io/efficientR/data-carpentry.html#data-aggregation Efficient R programming]. | |||
* [https:// | : <syntaxhighlight lang='rsplus'> | ||
* | data(wb_ineq, package = "efficient") | ||
* | wb_ineq %>% | ||
* | filter(grepl("g", Country)) %>% | ||
* | group_by(Year) %>% | ||
* | summarise(gini = mean(gini, na.rm = TRUE)) %>% | ||
arrange(desc(gini)) %>% | |||
top_n(n = 5) | |||
</syntaxhighlight> | |||
* [https://drdoane.com/writing-pipe-friendly-functions/ Writing Pipe-friendly Functions] | |||
* http://rud.is/b/2015/02/04/a-step-to-the-right-in-r-assignments/ | |||
<syntaxhighlight lang='rsplus'> | * http://rpubs.com/tjmahr/pipelines_2015 | ||
* http://danielmarcelino.com/i-loved-this-crosstable/ | |||
# | * http://moderndata.plot.ly/using-the-pipe-operator-in-r-with-plotly/ | ||
* RMSE | |||
: <syntaxhighlight lang='rsplus'> | |||
f <- function(x) { | |||
(y - x) %>% | |||
'^'(2) %>% | |||
sum %>% | |||
'/'(length(x)) %>% | |||
sqrt %>% | |||
round(2) | |||
} | |||
</syntaxhighlight> | |||
* [https://nathaneastwood.github.io/2020/02/01/get-and-set-list-elements-with-magrittr/ Get and Set List Elements with magrittr] | |||
* Videos | |||
** [https://www.rstudio.com/resources/videos/writing-readable-code-with-pipes/ Writing Readable Code with Pipes] | |||
** [https://youtu.be/iIBTI_qiq9g Pipes in R - An Introduction to magrittr package] | |||
: <syntaxhighlight lang='rsplus'> | |||
# Examples from R for Data Science-Import, Tidy, Transform, Visualize, and Model | |||
diamonds <- ggplot2::diamonds | |||
diamonds2 <- diamonds %>% dplyr::mutate(price_per_carat = price / carat) | |||
pryr::object_size(diamonds) | |||
pryr::object_size(diamonds2) | |||
pryr::object_size(diamonds, diamonds2) | |||
rnorm(100) %>% matrix(ncol = 2) %>% plot() %>% str() | |||
rnorm(100) %>% matrix(ncol = 2) %T>% plot() %>% str() # 'tee' pipe | |||
# %T>% works like %>% except that it returns the lefthand side (rnorm(100) %>% matrix(ncol = 2)) | |||
# instead of the righthand side. | |||
# | # If a function does not have a data frame based api, you can use %$%. | ||
# It explodes out the variables in a data frame. | |||
mtcars %$% cor(disp, mpg) | |||
# | # For assignment, magrittr provides the %<>% operator | ||
mtcars <- mtcars %>% transform(cyl = cyl * 2) # can be simplified by | |||
mtcars %<>% transform(cyl = cyl * 2) | |||
</syntaxhighlight> | </syntaxhighlight> | ||
* [https://data-and-the-world.onrender.com/posts/magrittr-pipes The Four Pipes of magrittr] and lambda functions. | |||
* | Upsides of using magrittr: no need to create intermediate objects, code is easy to read. | ||
: | |||
When not to use the pipe | |||
* your pipes are longer than (say) 10 steps | |||
* you have multiple inputs or outputs | |||
* Functions that use the current environment: assign(), get(), load() | |||
* Functions that use lazy evaluation: tryCatch(), try() | |||
== Dollar sign .$ == | |||
<ul> | <ul> | ||
<li>[http:// | <li>[http://thatdatatho.com/2019/03/13/tutorial-about-magrittrs-pipe-operator-and-placeholders/ A Short Tutorial about Magrittr’s Pipe Operator and Placeholders], [https://uc-r.github.io/pipe Simplify Your Code with %>%] | ||
{{Pre}} | |||
gapminder %>% dplyr::filter(continent == "Asia") %>% | |||
{stats::cor(.$lifeExp, .$gdpPercap)} | |||
} | gapminder %>% dplyr::filter(continent == "Asia") %$% | ||
{stats::cor(lifeExp, gdpPercap)} | |||
gapminder %>% | |||
dplyr::mutate(continent = ifelse(.$continent == "Americas", "Western Hemisphere", .$continent)) | |||
</pre> | |||
</ | </li> | ||
<li>Another example [https://cran.r-project.org/web/packages/msigdbr/vignettes/msigdbr-intro.html Introduction to the msigdbr package] | |||
<pre> | |||
m_list = m_df %>% split(x = .$gene_symbol, f = .$gs_name) | |||
m_list2 = m_df %$% split(x = gene_symbol, f = gs_name) | |||
all.equal(m_list, m_list2) | |||
# [1] TRUE | |||
</pre> | |||
</li> | </li> | ||
<li>[https:// | <li>[https://stackoverflow.com/a/48130912 Use $ dollar sign at end of of an R magrittr pipeline to return a vector] | ||
< | <pre> | ||
DF %>% filter(y > 0) %>% .$y | |||
</pre> | |||
</ | |||
</li> | </li> | ||
</ul> | </ul> | ||
== | == %$% == | ||
Expose the names in lhs to the rhs expression. This is useful when functions do not have a built-in data argument. | |||
<pre> | |||
lhs %$% rhs | |||
# lhs: A list, environment, or a data.frame. | |||
# rhs: An expression where the names in lhs is available. | |||
iris %>% | |||
subset(Sepal.Length > mean(Sepal.Length)) %$% | |||
cor(Sepal.Length, Sepal.Width) | |||
</pre> | |||
= | == set_rownames() and set_colnames() == | ||
https:// | https://stackoverflow.com/a/56613460, https://www.rdocumentation.org/packages/magrittr/versions/1.5/topics/extract | ||
<pre> | |||
data.frame(x=1:5, y=2:6) %>% magrittr::set_rownames(letters[1:5]) | |||
[ | cbind(1:5, 2:6) %>% magrittr::set_colnames(letters[1:2]) | ||
</pre> | |||
= | == match() == | ||
<syntaxhighlight lang='r'> | |||
a <- 1:3 | |||
id <- letters[1:3] | |||
set.seed(1234); id.ref <- sample(id) | |||
id # [1] "b" "c" "a" | |||
a[match(id.ref, b)] # [1] 2 3 1 | |||
id.ref %>% match(b) %>% `[`(a, .) # Same, but complicated | |||
</syntaxhighlight> | |||
> | |||
== dtrackr == | |||
[https://terminological.github.io/dtrackr/ dtrackr]: Track your Data Pipelines | |||
</syntaxhighlight> | |||
= | = purrr: : Functional Programming Tools = | ||
[ | ''While there is nothing fundamentally wrong with the base R apply functions, the syntax is somewhat inconsistent across the different apply functions, and the expected type of the object they return is often ambiguous (at least it is for sapply…).'' See [http://www.rebeccabarter.com/blog/2019-08-19_purrr/ Learn to purrr]. | ||
* https://purrr.tidyverse.org/ | |||
* Chap 21 [https://r4ds.had.co.nz/iteration.html Iteration] from '''R for Data Science''' book | |||
* [https://github.com/rstudio/cheatsheets/raw/master/purrr.pdf cheatsheet] | |||
* [http://colinfay.me/purrr-cookbook/ purrr cookbook] | |||
* [https://en.wikipedia.org/wiki/Higher-order_function Higher-order function] | |||
* [https://pythonbasics.org/decorators/ Python Decorator/metaprogramming] | |||
* [https://www.r-bloggers.com/2020/11/iterating-over-the-lines-of-a-data-frame-with-purrr/ Iterating over the lines of a data.frame with purrr] | |||
* Functional programming (cf Object-Oriented Programming) | |||
** [http://www.youtube.com/watch?v=vLmaZxegahk Functional programming for beginners] | |||
** [https://www.makeuseof.com/tag/functional-programming-languages/ 5 Functional Programming Languages You Should Know] | |||
<ul> | |||
<li>[https://stackoverflow.com/a/56651232 What does the tilde mean in this context of R code], [https://stackoverflow.com/a/44834671 What is meaning of first tilde in purrr::map] </li> | |||
<li>[http://data.library.virginia.edu/getting-started-with-the-purrr-package-in-r/ Getting started with the purrr package in R], especially the [https://www.rdocumentation.org/packages/purrr/versions/0.2.5/topics/map map()] and '''map_df()''' functions. | |||
<syntaxhighlight lang='rsplus'> | |||
library(purrr) | |||
# map() is a replacement of lapply() | |||
# lapply(dat, function(x) mean(x$Open)) | |||
map(dat, function(x)mean(x$Open)) | |||
# map allows us to bypass the function function. | |||
# Using a tilda (~) in place of function and a dot (.) in place of x | |||
map(dat, ~mean(.$Open)) | |||
# map allows you to specify the structure of your output. | |||
map_dbl(dat, ~mean(.$Open)) | |||
# map2() is a replacement of mapply() | |||
# mapply(function(x,y)plot(x$Close, type = "l", main = y), x = dat, y = stocks) | |||
map2(dat, stocks, ~plot(.x$Close, type="l", main = .y)) | |||
</syntaxhighlight> | |||
</li> | |||
</ul> | |||
* map_dfr() function from [https://youtu.be/bzUmK0Y07ck?t=646 "The Joy of Functional Programming (for Data Science)" with Hadley Wickham]. It can be used to replace a loop. | |||
:<syntaxhighlight lang='rsplus'> | |||
data <- map(paths, read.csv) | |||
data <- map_dfr(paths, read.csv, id = "path") | |||
out1 <- mtcars %>% map_dbl(mean, na.rm = TRUE) | |||
out2 <- mtcars %>% map_dbl(median, na.rm = TRUE) | |||
</syntaxhighlight> | |||
* [http://staff.math.su.se/hoehle/blog/2019/01/04/mathgenius.html Purr yourself into a math genius] | |||
* [https://martinctc.github.io/blog/vignette-write-and-read-multiple-excel-files-with-purrr/ Write & Read Multiple Excel files with purrr] | |||
* [https://aosmith.rbind.io/2020/08/31/handling-errors/ Handling errors using purrr's possibly() and safely()] | |||
* [https://www.business-science.io/code-tools/2020/10/08/automate-plots.html How to Automate Exploratory Analysis Plots] | |||
* [https://www.infoworld.com/article/3601124/error-handling-in-r-with-purrrs-possibly.amp.html Easy error handling in R with purrr’s possibly] | |||
<ul> | |||
<li>[http://www.rebeccabarter.com/blog/2019-08-19_purrr/ Learn to purrr]. Lots of good information like tilde-dot is a shorthand for functions. | |||
<syntaxhighlight lang='rsplus'> | |||
function(x) { | |||
x + 10 | |||
} | |||
# is the same as | |||
~{.x + 10} | |||
map_dbl(c(1, 4, 7), ~{.x + 10}) | |||
</syntaxhighlight> | |||
</li> | |||
<li>[https://aosmith.rbind.io/2018/06/05/a-closer-look-at-replicate-and-purrr/ A closer look at replicate() and purrr::map() for simulations] | |||
<syntaxhighlight lang='rsplus'> | |||
twogroup_fun = function(nrep = 10, b0 = 5, b1 = -2, sigma = 2) { | |||
ngroup = 2 | |||
group = rep( c("group1", "group2"), each = nrep) | |||
eps = rnorm(ngroup*nrep, 0, sigma) | |||
growth = b0 + b1*(group == "group2") + eps | |||
growthfit = lm(growth ~ group) | |||
growthfit | |||
} | |||
sim_lm = replicate(5, twogroup_fun(), simplify = FALSE ) | |||
str(sim_lm, max.level = 1) | |||
map_dbl(sim_lm, ~summary(.x)$r.squared) | |||
# Same as function(x) {} style | |||
map_dbl(sim_lm, function(x) summary(x)$r.squared) | |||
# Same as sapply() | |||
sapply(sim_lm, function(x) summary(x)$r.squared) | |||
map_dfr(sim_lm, broom::tidy, .id = "model") | |||
</syntaxhighlight> | |||
</li> | |||
<li>[http://adv-r.had.co.nz/Functional-programming.html Functional programming] from Advanced R.</li> | |||
<li>[https://dcl-prog.stanford.edu/ Functional Programming] : Sara Altman, Bill Behrman, Hadley Wickham</li> | |||
<li>[https://www.brodrigues.co/blog/2022-05-26-safer_programs/ Some learnings from functional programming you can use to write safer programs] </li> | |||
</ul> | |||
== map() and map_dbl() == | |||
<Ul> | |||
<Li>[https://www.spsanderson.com/steveondata/posts/2023-03-26/index.html Mastering the map() Function in R] | |||
<li>An example from https://purrr.tidyverse.org/ | |||
<syntaxhighlight lang='rsplus'> | |||
mtcars |> | |||
split(mtcars$cyl) |> # from base R | |||
map(\(df) lm(mpg ~ wt, data = df)) |> | |||
map(summary) |> map_dbl("r.squared") | |||
# 4 6 8 | |||
# 0.5086326 0.4645102 0.4229655 | |||
</syntaxhighlight> | |||
<li>Solution by base R lapply() and sapply(). See the article [https://purrr.tidyverse.org/articles/base.html purrr <-> base R] | |||
<syntaxhighlight lang='rsplus'> | |||
mtcars |> | |||
split(mtcars$cyl) |> | |||
lapply(function(df) lm(mpg ~ wt, data = df)) |> | |||
lapply(summary) |> | |||
sapply(function(x) x$r.squared) | |||
# 4 6 8 | |||
# 0.5086326 0.4645102 0.4229655 | |||
</syntaxhighlight> | |||
</ul> | |||
== tilde == | |||
* The '''lambda syntax''' and tilde notation provided by purrr allow you to write concise and readable anonymous functions in R. | |||
:<syntaxhighlight lang='rsplus'> | |||
x <- 1:3 | |||
map_dbl(x, ~ .x^2) # [1] 1 4 9 | |||
</syntaxhighlight> | |||
:The notation '''~ .x^2''' is equivalent to writing '''function(.x) .x^2 ''' or '''function(z) z^2''' or '''\(y) y^2''' | |||
:<syntaxhighlight lang='rsplus'> | |||
x <- list(a = 1:3, b = 4:6) | |||
y <- list(a = 10, b = 100) | |||
map2_dbl(x, y, ~ sum(.x * .y)) | |||
# a b | |||
# 60 1500 | |||
</syntaxhighlight> | |||
* https://dplyr.tidyverse.org/reference/funs.html | |||
* [https://stackoverflow.com/a/14976479 Use of ~ (tilde) in R programming Language] (Hint: creating a formula object) | |||
* [https://stackoverflow.com/a/44834671 What is meaning of first tilde in purrr::map] & the blog [https://www.itcodar.com/r/what-is-meaning-of-first-tilde-in-purrr-map.html What Is Meaning of First Tilde in Purrr::Map] | |||
* [https://stackoverflow.com/a/68249687 Meaning of tilde and dot notation in dplyr] | |||
* [https://www.rebeccabarter.com/blog/2019-08-19_purrr Learn to purrr] 2019 | |||
* [https://stackoverflow.com/q/58845722 dplyr piping data - difference between `.` and `.x`] | |||
* [https://stackoverflow.com/a/62488532 Use of Tilde (~) and period (.) in R] | |||
== .x symbol == | |||
<ul> | |||
<li>It is used with functions like purrr::map. In the context of an '''anonymous function''', '''.x''' is a '''placeholder''' for the first argument of the function. | |||
* For a single argument function, you can use .. For example, ~ . + 2 is equivalent to function(.) {. + 2}. | |||
* For a two argument function, you can use .x and .y. For example, ~ .x + .y is equivalent to function(.x, .y) {.x + .y}. | |||
* For more arguments, you can use ..1, ..2, ..3, etc | |||
<pre> | |||
# Create a vector | |||
vec <- c(1, 2, 3) | |||
# Use purrr::map with an anonymous function | |||
result <- purrr::map(vec, ~ .x * 2) | |||
# Print the result | |||
print(result) | |||
[[1]] | |||
[1] 2 | |||
[[2]] | |||
[1] 4 | |||
[[3]] | |||
[1] 6 | |||
</pre> | |||
<li>[https://stackoverflow.com/a/56532176 dplyr piping data - difference between `.` and `.x`] | |||
<li>[https://community.rstudio.com/t/function-argument-naming-conventions-x-vs-x/7764/2 Function argument naming conventions (`.x` vs `x`)]. Se [https://purrr.tidyverse.org/reference/map.html purrr::map] | |||
</ul> | |||
== negate() == | |||
[https://stackoverflow.com/a/48431135 How to select non-numeric columns using dplyr::select_if] | |||
<syntaxhighlight lang='rsplus'> | |||
library(tidyverse) | |||
iris %>% select_if(negate(is.numeric)) | |||
</syntaxhighlight> | |||
== pmap() == | |||
[https://purrr.tidyverse.org/reference/pmap.html ?pmap] - Map over multiple input simultaneously (in "parallel") | |||
<pre> | <pre> | ||
R> str(survfit(Surv(time, status) ~ x, data = aml)) | # Create two lists with multiple elements | ||
List of 17 | list1 <- list(1, 2, 3) | ||
$ n : int [1:2] 11 12 | list2 <- list(10, 20, 30) | ||
$ time : num [1:20] 9 13 18 23 28 31 34 45 48 161 ... | |||
$ n.risk : num [1:20] 11 10 8 7 6 5 4 3 2 1 ... | # Define a function to add the elements of each list | ||
$ n.event : num [1:20] 1 1 1 1 0 1 1 0 1 0 ... | my_func <- function(x, y) { | ||
... | x + y | ||
} | |||
R> tidy(survfit(Surv(time, status) ~ x, data = aml)) | |||
# A tibble: 20 x 9 | # Use pmap to apply the function to each element of the lists in parallel | ||
time n.risk n.event n.censor estimate std.error conf.high conf.low strata | result <- pmap(list(list1, list2), my_func); result | ||
<dbl> <dbl> <dbl> <dbl> <dbl> <dbl> <dbl> <dbl> <chr> | [[1]] | ||
1 9 11 1 0 0.909 0.0953 1 0.754 x=Maintained | [1] 11 | ||
2 13 10 1 1 0.818 0.142 1 0.619 x=Maintained | |||
... | [[2]] | ||
18 33 3 1 0 0.194 0.627 0.664 0.0569 x=Nonmaintained | [1] 22 | ||
19 43 2 1 0 0.0972 0.945 0.620 0.0153 x=Nonmaintained | |||
20 45 1 1 0 0 Inf NA NA x=Nonmaintained | [[3]] | ||
</pre> | [1] 33 | ||
</pre> | |||
A more practical example when we want to run analysis or visualization on each element of some group/class variable. nest() + pmap(). | |||
<syntaxhighlight lang='rsplus'> | |||
# Create a data frame | |||
df <- mpg %>% | |||
filter(manufacturer %in% c("audi", "volkswagen")) %>% | |||
select(manufacturer, year, cty) | |||
# Nest the data by manufacturer | |||
df_nested <- df %>% | |||
nest(data = -manufacturer) | |||
# Create a function that takes a data frame and creates a ggplot object | |||
my_plot_func <- function(data, manuf) { | |||
ggplot(data, aes(x = year, y = cty)) + | |||
geom_point() + | |||
ggtitle(manuf) | |||
} | |||
# Use pmap to apply the function to each element of the list-column in df_nested | |||
df_nested_plot <- df_nested %>% | |||
mutate(plot = pmap(list(data, manufacturer), my_plot_func)) | |||
df_nested_plot[[1]] | |||
</syntaxhighlight> | |||
Another example: fitting regressions for data in each group | |||
<syntaxhighlight lang='rsplus'> | |||
library(tidyverse) | |||
# create example data | |||
data <- tibble( | |||
x = rnorm(100), | |||
y = rnorm(100), | |||
group = sample(c("A", "B", "C"), 100, replace = TRUE) | |||
) | |||
# create a nested dataframe | |||
nested_data <- data %>% | |||
nest(data = -group) | |||
# define a function that runs linear regression on each dataset | |||
lm_func <- function(data) { | |||
lm(y ~ x, data = data) | |||
} | |||
# apply lm_func() to each row of the nested dataframe | |||
results <- nested_data %>% | |||
mutate(model = pmap(list(data), lm_func)) | |||
</syntaxhighlight> | |||
== reduce == | |||
[https://www.r-bloggers.com/2023/07/reducing-my-for-loop-usage-with-purrrreduce/ Reducing my for loop usage with purrr::reduce()] | |||
== filter, subset data == | |||
[https://jcarroll.com.au/2023/08/30/four-filters-for-functional-programming-friends/ Four Filters for Functional (Programming) Friends] | |||
== purrr vs base R == | |||
https://purrr.tidyverse.org/dev/articles/base.html | |||
= forcats = | |||
https://forcats.tidyverse.org/ | |||
[https://www.datasurg.net/2019/10/15/jama-retraction-after-miscoding-new-finalfit-function-to-check-recoding/ JAMA retraction after miscoding – new Finalfit function to check recoding] | |||
= outer() = | |||
= Genomic sequence = | |||
* chartr | |||
<syntaxhighlight lang='bash'> | |||
> yourSeq <- "AAAACCCGGGTTTNNN" | |||
> chartr("ACGT", "TGCA", yourSeq) | |||
[1] "TTTTGGGCCCAAANNN" | |||
</syntaxhighlight> | |||
= broom = | |||
<ul> | |||
<li>[https://cran.r-project.org/web/packages/broom/index.html broom]: Convert Statistical Analysis Objects into Tidy Tibbles | |||
<li>Especially the tidy() function. | |||
{{Pre}} | |||
R> str(survfit(Surv(time, status) ~ x, data = aml)) | |||
List of 17 | |||
$ n : int [1:2] 11 12 | |||
$ time : num [1:20] 9 13 18 23 28 31 34 45 48 161 ... | |||
$ n.risk : num [1:20] 11 10 8 7 6 5 4 3 2 1 ... | |||
$ n.event : num [1:20] 1 1 1 1 0 1 1 0 1 0 ... | |||
... | |||
R> tidy(survfit(Surv(time, status) ~ x, data = aml)) | |||
# A tibble: 20 x 9 | |||
time n.risk n.event n.censor estimate std.error conf.high conf.low strata | |||
<dbl> <dbl> <dbl> <dbl> <dbl> <dbl> <dbl> <dbl> <chr> | |||
1 9 11 1 0 0.909 0.0953 1 0.754 x=Maintained | |||
2 13 10 1 1 0.818 0.142 1 0.619 x=Maintained | |||
... | |||
18 33 3 1 0 0.194 0.627 0.664 0.0569 x=Nonmaintained | |||
19 43 2 1 0 0.0972 0.945 0.620 0.0153 x=Nonmaintained | |||
20 45 1 1 0 0 Inf NA NA x=Nonmaintained | |||
</pre> | |||
<li>[https://www.frontiersin.org/files/Articles/746571/fonc-11-746571-HTML-r1/image_m/fonc-11-746571-t002.jpg Tables from journal papers] | |||
<li>Multiple univariate models | |||
<pre> | |||
library(tidyverse) | |||
library(broom) | |||
mtcars %>% | |||
select(-mpg) %>% | |||
names() %>% | |||
map_dfr(~ tidy(lm(as.formula(paste("mpg ~", .x)), data = mtcars))) | |||
# A tibble: 20 × 5 | |||
# term estimate std.error statistic p.value | |||
# <chr> <dbl> <dbl> <dbl> <dbl> | |||
# 1 (Intercept) 37.9 2.07 18.3 8.37e-18 | |||
# 2 cyl -2.88 0.322 -8.92 6.11e-10 | |||
# 3 (Intercept) 29.6 1.23 24.1 3.58e-21 | |||
# 4 disp -0.0412 0.00471 -8.75 9.38e-10 | |||
</pre> | |||
<li>Multivariate model | |||
<pre> | |||
lm(mpg ~ ., data = mtcars) |> tidy() | |||
# A tibble: 11 × 5 | |||
# term estimate std.error statistic p.value | |||
# <chr> <dbl> <dbl> <dbl> <dbl> | |||
# 1 (Intercept) 12.3 18.7 0.657 0.518 | |||
# 2 cyl -0.111 1.05 -0.107 0.916 | |||
# 3 disp 0.0133 0.0179 0.747 0.463 | |||
</pre> | |||
</ul> | |||
= lobstr package - dig into the internal representation and structure of R objects = | |||
[https://www.tidyverse.org/articles/2018/12/lobstr/ lobstr 1.0.0] | |||
= Other packages = | |||
== Great R packages for data import, wrangling, and visualization == | |||
[https://www.computerworld.com/article/2921176/great-r-packages-for-data-import-wrangling-visualization.html Great R packages for data import, wrangling, and visualization] | |||
= | == cli package == | ||
* https://cli.r-lib.org/ | |||
* [https://www.r-bloggers.com/2023/11/cliff-notes-about-the-cli-package/ Cliff notes about the cli package] | |||
[https://www. | |||
== tidytext == | == tidytext == | ||
Latest revision as of 20:18, 22 April 2024
Tidyverse
   Import
     |
     | readr, readxl
     | haven, DBI, httr   +----- Visualize ------+
     |                    |    ggplot2, ggvis    |
     |                    |                      |
   Tidy ------------- Transform
   tibble               dplyr                   Model
   tidyr                  |                    broom
                          +------ Model ---------+
Cheat sheet
The cheat sheets are downloaded from RStudio
- Data Transformation with dply
- Data Import
- Data Import with readr, tibble, and tidyr (not in RStudio anymore?)
Books
Going from Beginner to Advanced in the Tidyverse
Online
- TidyverseSkeptic by Norm Matloff
- R for Data Science and tidyverse package (it is a collection of ggplot2, tibble, tidyr, readr, purrr, dplyr, stringr & forcats 8 packages).
- tidyverse, among others, was used at Mining CRAN DESCRIPTION Files (tbl_df(), %>%, summarise(), count(), mutate(), arrange(), unite(), ggplot(), filter(), select(), ...). Note that there is a problem to reproduce the result. I need to run cran <- cran[, -14] to remove the MD5sum column.
- Compile R for Data Science to a PDF
- The tidyverse style guide by Hadley Wickham
- Data Wrangling with dplyr and tidyr Cheat Sheet
- Data Wrangling with Tidyverse from the Harvard Chan School of Public Health.
- Best packages for data manipulation in R. It demonstrates to perform the same tasks using data.table and dplyr packages. data.table is faster and it may be a go-to package when performance and memory are the constraints.
- DATA MANIPULATION IN R by Alboukadel Kassambara
- subset data frame columns: pull() [return a vector], select() [return data frame], select_if(), other helper functions
- subset (filter) data frame rows: slice(), filter(), filter_all(), filter_if(), filter_at(), sample_n(), top_n()
- identify and remove duplicate rows: duplicated(), unique(), distinct(). distinct() will keep only distinct variables if variables are specified (cf select() which keeps all rows0.
- ordering rows: arrange(), desc()
- cf stats::reorder() to change a factor variable's order based on another variable. So the output is still a vector. It is useful in creating multiple boxplots. On the other hand, arrange() is to change the row order of a data frame and its input is a data frame.
- desc() can be used in arrange() [see ?desc] and reorder() [see ordered barplot ] too.
- desc(x) is just doing the negative operation -x.
- renaming and adding columns: rename()
- compute and add new variables to a data frame: mutate(), transmutate()
- computing summary statistics (pay to view)
- Data manipulation in r using data frames - an extensive article of basics
- The A to Z of tidyverse from Deeply Trivial
- Summer Institute in Statistics for Big Data (SISBID), SISBID 2020 Modules
- Complete tutorial
Animation to explain
- tidyexplain - Tidy Animated Verbs
- Tidy Data Tutor helps you visualize data analysis pipelines
Base-R and Tidyverse
tidyverse vs python panda
Why pandas feels clunky when coming from R
Examples
A Gentle Introduction to Tidy Statistics in R
A Gentle Introduction to Tidy Statistics in R by Thomas Mock on RStudio webinar. Good coverage with step-by-step explanation. See part 1 & part 2 about the data and markdown document. All documents are available in github repository.
| Task | R code | Graph |
|---|---|---|
| Load the libraries | library(tidyverse) library(readxl) library(broom) library(knitr) |
|
| Read Excel file | raw_df <- readxl::read_xlsx("ad_treatment.xlsx")
dplyr::glimpse(raw_df)
|
|
| Check distribution | g2 <- ggplot(raw_df, aes(x = age)) +
geom_density(fill = "blue")
g2
raw_df %>% summarize(min = min(age),
max = max(age))
|
File:Check dist.svg |
| Data cleaning | raw_df %>% summarize(na_count = sum(is.na(mmse))) |
|
| Experimental variables
levels |
# check Ns and levels for our variables table(raw_df$drug_treatment, raw_df$health_status) table(raw_df$drug_treatment, raw_df$health_status, raw_df$sex) # tidy way of looking at variables raw_df %>% group_by(drug_treatment, health_status, sex) %>% count() |
|
| Visual Exploratory
Data Analysis |
ggplot(data = raw_df, # add the data
       aes(x = drug_treatment, y = mmse, # set x, y coordinates
           color = drug_treatment)) +    # color by treatment
  geom_boxplot() +
  facet_grid(~health_status)
|
File:Onefacet.svg |
| Summary Statistics | raw_df %>%
glimpse()
sum_df <- raw_df %>%
mutate(
sex = factor(sex,
labels = c("Male", "Female")),
drug_treatment = factor(drug_treatment,
levels = c("Placebo", "Low dose", "High Dose")),
health_status = factor(health_status,
levels = c("Healthy", "Alzheimer's"))
) %>%
group_by(sex, health_status, drug_treatment # group by categorical variables
) %>%
summarize(
mmse_mean = mean(mmse), # calc mean
mmse_se = sd(mmse)/sqrt(n()) # calc standard error
) %>%
ungroup() # ungrouping variable is a good habit to prevent errors
kable(sum_df)
write.csv(sum_df, "adx37_sum_stats.csv")
|
|
| Plotting summary
statistics |
g <- ggplot(data = sum_df, # add the data
       aes(x = drug_treatment,  #set x, y coordinates
           y = mmse_mean,
           group = drug_treatment,  # group by treatment
           color = drug_treatment)) +    # color by treatment
  geom_point(size = 3) + # set size of the dots
  facet_grid(sex~health_status) # create facets by sex and status
g
|
File:Twofacets.svg |
| ANOVA | # set up the statistics df
stats_df <- raw_df %>% # start with data
mutate(drug_treatment = factor(drug_treatment, levels = c("Placebo", "Low dose", "High Dose")),
sex = factor(sex, labels = c("Male", "Female")),
health_status = factor(health_status, levels = c("Healthy", "Alzheimer's")))
glimpse(stats_df)
# this gives main effects AND interactions
ad_aov <- aov(mmse ~ sex * drug_treatment * health_status,
data = stats_df)
summary(ad_aov)
# this extracts ANOVA output into a nice tidy dataframe
tidy_ad_aov <- tidy(ad_aov)
# which we can save to Excel
write.csv(tidy_ad_aov, "ad_aov.csv")
|
|
| Post-hocs | # pairwise t.tests
ad_pairwise <- pairwise.t.test(stats_df$mmse,
stats_df$sex:stats_df$drug_treatment:stats_df$health_status,
p.adj = "none")
# look at the posthoc p.values in a tidy dataframe
kable(head(tidy(ad_pairwise)))
# call and tidy the tukey posthoc
tidy_ad_tukey <- tidy(
TukeyHSD(ad_aov,
which = 'sex:drug_treatment:health_status'))
|
|
| Publication plot | sig_df <- tribble(
~drug_treatment, ~ health_status, ~sex, ~mmse_mean,
"Low dose", "Alzheimer's", "Male", 17,
"High Dose", "Alzheimer's", "Male", 25,
"Low dose", "Alzheimer's", "Female", 18,
"High Dose", "Alzheimer's", "Female", 24
)
sig_df <- sig_df %>%
mutate(drug_treatment = factor(drug_treatment, levels = c("Placebo", "Low dose", "High Dose")),
sex = factor(sex, levels = c("Male", "Female")),
health_status = factor(health_status, levels = c("Healthy", "Alzheimer's")))
sig_df
# plot of cognitive function health and drug treatment
g1 <- ggplot(data = sum_df,
aes(x = drug_treatment, y = mmse_mean, fill = drug_treatment,
group = drug_treatment)) +
geom_errorbar(aes(ymin = mmse_mean - mmse_se,
ymax = mmse_mean + mmse_se), width = 0.5) +
geom_bar(color = "black", stat = "identity", width = 0.7) +
facet_grid(sex~health_status) +
theme_bw() +
scale_fill_manual(values = c("white", "grey", "black")) +
theme(legend.position = "NULL",
legend.title = element_blank(),
axis.title = element_text(size = 20),
legend.background = element_blank(),
panel.grid.major = element_blank(),
panel.grid.minor = element_blank(),
axis.text = element_text(size = 12)) +
geom_text(data = sig_df, label = "*", size = 8) +
labs(x = "\nDrug Treatment",
y = "Cognitive Function (MMSE)\n",
caption = "\nFigure 1. Effect of novel drug treatment AD-x37 on cognitive function in
healthy and demented elderly adults.
\nn = 100/treatment group (total n = 600), * indicates significance
at p < 0.001")
g1
# save the graph!
ggsave("ad_publication_graph.png", g1, height = 7, width = 8, units = "in")
|
File:Ad public.svg |
palmerpenguins data
Introduction to data manipulation in R with {dplyr}
glm() and ggplot2(), mtcars
data(mtcars)

# Fit a Poisson regression model to predict "mpg" based on "wt"
model <- mtcars %>%
  select(mpg, wt) %>%
  mutate(wt = as.numeric(wt)) %>%
  glm(mpg ~ wt, family = poisson(link = "log"), data = .)

# Print the summary of the model
summary(model)

# Make predictions on new data
new_data <- data.frame(wt = c(2.5, 3.0, 3.5))
predictions <- predict(model, new_data, type = "response")
print(predictions)

# Visualize the results with ggplot2
ggplot(data = mtcars, aes(x = wt, y = mpg)) +
  geom_point() +
  stat_smooth(method = "glm", formula = "y ~ x",
              method.args = list(family = poisson(link = "log")),
              se = FALSE, color = "red") +
  labs(x = "Weight", y = "Miles per gallon")
Opioid prescribing habits in texas
https://juliasilge.com/blog/texas-opioids/.
- It can read multiple sheets (27 sheets) at a time and merge them by rows.
- case_when(): A general vectorised if. This function allows you to vectorise multiple if_else() statements. How to use the R case_when function.
case_when(
  condition_1 ~ result_1,
  condition_2 ~ result_2,
  ...
  condition_n ~ result_n,
  .default = default_result
)
x %>% mutate(group = case_when(
  PredScore > quantile(PredScore, .5) ~ 'High',
  PredScore < quantile(PredScore, .5) ~ 'Low',
  TRUE ~ NA_character_
))
- fill()
- bind_rows(). Another example. Error in rbind(deparse.level, …) : numbers of columns of arguments do not match.
- full_join(), left_join(), right_join(), inner_join(). See the exercises from Useful dplyr functions (with examples). Suppose df1=50x3, df2=45x3 with 25 overlaps. Then left_join=50x5, right_join=45x5, inner_join=25x5, full_join=70x5.
- gather()
- replace_na()
- str_to_title()
- count(), Count Observations by Group in R
- How to Count Distinct Values in R n_distinct(), Filtering for Unique Values in R- Using the dplyr
-
top_n(). weight parameter. top_n(n=5, wt=x) won't order rows by weight in the output actually. slice_max(order_by = x, n = 5) does it.
set.seed(1)
d <- data.frame(
  x   = runif(90),
  grp = gl(3, 30)
)

> d %>% group_by(grp) %>% top_n(5, wt=x)
# A tibble: 15 x 2
# Groups:   grp [3]
       x grp
   <dbl> <fct>
 1 0.908 1
 2 0.898 1
...
15 0.961 3

> d %>% group_by(grp) %>% slice_max(order_by = x, n = 5)
# A tibble: 15 x 2
# Groups:   grp [3]
       x grp
   <dbl> <fct>
 1 0.992 1
 2 0.945 1
...
15 0.864 3
Tidying the Freedom Index
https://pacha.dev/blog/2023/06/05/freedom-index/index.html
tidyverse
- gsub()
- read_excel()
- filter()
- pivot_longer()
- case_when()
- fill()
- group_by(), mutate(), row_number(), ungroup()
- pivot_wider()
- drop_na()
- ungroup(), distinct()
- left_join()
ggplot2
- geom_line()
- facet_wrap()
- theme_minimal()
- theme()
- labs()
Useful dplyr functions (with examples)
- https://sw23993.wordpress.com/2017/07/10/useful-dplyr-functions-wexamples/
- Eight R Tidyverse tips for everyday data engineering
- My top 10 favorite dplyr tips and tricks
- Rename columns by using the dplyr select function
- Calculate in row context with dplyr
- Rearrange columns quickly with dplyr everything
- Drop unnecessary columns with dplyr
- Use dplyr count or add_count instead of group_by and summarize
- Replace nested ifelse with dplyr case_when function
- Execute calculations across columns conditionally with dplyr
- Filter by calculation of grouped data inside filter function
- Get top and bottom values by each group with dplyr
- Reflow your dplyr code
Supervised machine learning case studies in R
Supervised machine learning case studies in R - A Free, Interactive Course Using Tidy Tools.
Time series data
- Automating update of a fiscal database for the Euro Area
- readxl::read_excel()
- transmute() (transmute() adds new variables and drops any existing ones), as.Date()
- filter(), is.na()
- na.omit(), first()
- filter(), gather(), bind_rows(), arrange()
- group_by(), summarize()
- rdb(), lubridate::year(), magrittr::%<>%, select(), spread(), mutate(), select(), gather()
- filter(), full_join(), transmute(), !is.na()
- bind_rows(), mutate()
- chain() (deprecated!)
- ungroup()
- tibble(), left_join()
- Exploring eu wide data on new car registrations and co2 efficiency (data is available)
Calculating change from baseline
group_by() + mutate() + ungroup(). We can accomplish the task by using split() + lapply() + do.call().
trial_data_chg <- trial_data %>%
  arrange(USUBJID, AVISITN) %>%
  group_by(USUBJID) %>%
  mutate(CHG = AVAL - AVAL[1L]) %>%
  ungroup()

# If the baseline is missing
trial_data_chg2 <- trial_data %>%
  group_by(USUBJID) %>%
  mutate(
    CHG = if (any(AVISIT == "Baseline")) AVAL - AVAL[AVISIT == "Baseline"] else NA
  ) %>%
  ungroup()
Split data and fitting models to subsets
https://twitter.com/romain_francois/status/1226967548144635907?s=20
library(dplyr)
iris %>%
  group_by(Species) %>%
  summarise(broom::tidy(lm(Petal.Length ~ Sepal.Length))
Show all possible group combinations
Ten Tremendous Tricks in the Tidyverse
https://youtu.be/NDHSBUN_rVU (video).
- count(),
- add_count(),
- summarize() w/ a list column,
- fct_reorder() + geom_col() + coord_flip(),
- fct_lump(),
- scale_x/y_log10(),
- crossing(),
- separate(),
- extract().
Gapminder dataset
Hands-on R and dplyr – Analyzing the Gapminder Dataset
Install on Ubuntu
sudo apt install r-cran-tidyverse

# Ubuntu >= 18.04. However, I get unmet dependencies errors on R 3.5.3.
# r-cran-curl : Depends: r-api-3.4
sudo apt-get install r-cran-curl r-cran-openssl r-cran-xml2

# Works fine on Ubuntu 16.04, 18.04, 20.04
sudo apt install libcurl4-openssl-dev libssl-dev libxml2-dev
80 R packages will be installed after tidyverse has been installed.
For RStudio server docker version (Debian 10), I also need to install zlib1g-dev
Install on Raspberry Pi/(ARM based) Chromebook
In additional to the requirements of installing on Ubuntu, I got an error when it is installing a dependent package fs: undefined symbol: pthread_atfork. The fs package version is 1.2.6. The solution is to add one line in fs/src/Makevars file and then install the "fs" package using the source on the local machine.
5 most useful data manipulation functions
- subset() for making subsets of data (natch)
- merge() for combining data sets in a smart and easy way
- melt()-reshape2 package for converting from wide to long data formats. See an example here where we want to combine multiple columns of values into 1 column. melt() is replaced by gather().
- dcast()-reshape2 package for converting from long to wide data formats (or just use tapply()), and for making summary tables
- ddply()-plyr package for doing split-apply-combine operations, which covers a huge swath of the most tricky data operations
Miscellaneous examples using tibble or dplyr packages
Print all columns or rows
- print(x, width = Inf) # all columns
- print(x, n = Inf) # all rows
Move a column to rownames
?tibble::column_to_rownames
# It assumes the input data frame has no row names; otherwise we will get
# Error: `df` must be a data frame without row names in `column_to_rownames()`
#
tibble::column_to_rownames(data.frame(x=letters[1:5], y = rnorm(5)), "x")
Move rownames to a variable
https://tibble.tidyverse.org/reference/rownames.html
tibble::rownames_to_column(trees, "newVar")
# Still a data frame
Old way add_rownames()
data.frame(x=1:5, y=2:6) %>% magrittr::set_rownames(letters[1:5]) %>% add_rownames("newvar")
# tibble object
Remove rows or columns only containing NAs
Surgically removing specific rows or columns that only contains `NA`s
library(dplyr)
df <- tibble(x = c(NA, NA, NA),
             y = c(2, 3, NA),
             z = c(NA, 5, NA) )

# removing columns where all elements are NA
df %>% select(where(~ !all(is.na(.x))))

# removing rows where all elements are NA
df %>% filter(if_any(.fns = ~ !is.na(.x)))
Rename variables
dplyr::rename(os, newName = oldName)
Drop/remove a variable/column
select(df, -x) # 'x' is the name of the variable
Drop a level
group_by() has a .drop argument so you can also group by factor levels that don't appear in the data. See this example.
Remove rownames
tibble has_rownames(), rownames_to_column(), column_to_rownames()
has_rownames(mtcars)
#> [1] TRUE

# Remove row names
remove_rownames(mtcars) %>% has_rownames()
#> [1] FALSE
> tibble::has_rownames(trees)
[1] FALSE
> rownames(trees)
 [1] "1"  "2"  "3"  "4"  "5"  "6"  "7"  "8"  "9"  "10" "11" "12" "13" "14" "15"
[16] "16" "17" "18" "19" "20" "21" "22" "23" "24" "25" "26" "27" "28" "29" "30"
[31] "31"
> rownames(trees) <- NULL
> rownames(trees)
 [1] "1"  "2"  "3"  "4"  "5"  "6"  "7"  "8"  "9"  "10" "11" "12" "13" "14" "15"
[16] "16" "17" "18" "19" "20" "21" "22" "23" "24" "25" "26" "27" "28" "29" "30"
[31] "31"
relocate: change column order
# Move Petal.Width column to appear next to Sepal.Width
iris %>% relocate(Petal.Width, .after = Sepal.Width) %>% head()

# Move Petal.Width to the last column
iris %>% relocate(Petal.Width, .after = last_col()) %>% head()
pull: extract a single column
x <- iris %>% filter(Species == 'setosa') %>% select(Sepal.Length) %>% pull()
# x <- iris %>% filter(Species == 'setosa') %>% pull(Sepal.Length)
# x <- iris %>% filter(Species == 'setosa') %>% .$Sepal.Length
y <- iris %>% filter(Species == 'virginica') %>% select(Sepal.Length) %>% pull()
t.test(x, y)
Convert Multiple Columns to Numeric
Convert Multiple Columns to Numeric in R. mutate_at(), mutate_if()
select(): extract multiple columns
slice(): select rows by index
mtcars %>% slice_max(mpg, n = 1)
#                 mpg cyl disp hp drat    wt qsec vs am gear carb
# Toyota Corolla 33.9   4 71.1 65 4.22 1.835 19.9  1  1    4    1

mtcars %>% slice(which.max(mpg))
#                 mpg cyl disp hp drat    wt qsec vs am gear carb
# Toyota Corolla 33.9   4 71.1 65 4.22 1.835 19.9  1  1    4    1
Reorder columns
reorder()
iris %>% ggplot(aes(x=Species, y = Sepal.Width)) +
         geom_boxplot() +
         xlab=("Species")

# reorder the boxplot based on the Species' median
iris %>% ggplot(aes(x=reorder(Species, Sepal.Width, FUN = median),
                    y=Sepal.Width)) +
         geom_boxplot() +
         xlab=("Species")
fct_reorder()
10 Tidyverse functions that might save your day
Standardize variables
Anonymous functions
- See R page
- lapply and anonymous functions
Transformation on multiple columns
- How to apply a transformation to multiple columns in R?
- df %>% mutate(across(c(col1, col2), function(x) x*2))
- df %>% summarise(across(c(col1, col2), mean, na.rm=TRUE))
- select() vs across()
- the across() and select() functions are both used to manipulate columns in a data frame
- The select() function is used to select columns from a data frame.
- The across() function is used to apply a function to multiple columns in a data frame. It’s often used inside other functions like mutate() or summarize().
data.frame(
  x = c(1, 2, 3),
  y = c(4, 5, 6)
) %>%
mutate(across(everything(), ~ .x * 2)) # purrr-style lambda
#  x  y
#1 2  8
#2 4 10
#3 6 12
Reading and writing data
Speeding up Reading and Writing in R
data.table
Fast aggregation of large data (e.g. 100GB in RAM or just several GB size file), fast ordered joins, fast add/modify/delete of columns by group using no copies at all, list columns and a fast file reader (fread).
Note: data.table has its own ways (cf base R and dplyr) to subset columns.
Some resources:
- https://www.rdocumentation.org/packages/data.table/versions/1.12.0
- cookbook
- R Packages: dplyr vs data.table
- Comparing Common Operations in dplyr and data.table
- Cheat sheet from RStudio
- Reading large data tables in R. fread(FILENAME)
- Note that 'x[, 2] always return 2. If you want to do the thing you want, use x[, 2, with=FALSE] or x[, V2] where V2 is the header name. See the FAQ #1 in data.table.
- Understanding data.table Rolling Joins
- Intro to The data.table Package
- Subsetting rows and/or columns
- Alternative to using tapply(), aggregate(), table() to summarize data
- Similarities to SQL, DT[i, j, by]
- R : data.table (with 50 examples) from ListenData
- Describe Data
- Selecting or Keeping Columns
- Rename Variables
- Subsetting Rows / Filtering
- Faster Data Manipulation with Indexing
- Performance Comparison
- Sorting Data
- Adding Columns (Calculation on rows)
- How to write Sub Queries (like SQL)
- Summarize or Aggregate Columns
- GROUP BY (Within Group Calculation)
- Remove Duplicates
- Extract values within a group
- SQL's RANK OVER PARTITION
- Cumulative SUM by GROUP
- Lag and Lead
- Between and LIKE Operator
- Merging / Joins
- Convert a data.table to data.frame
- R Tutorial: data.table from dezyre.com
- Syntax: DT[where, select|update|do, by]
- Keys and setkey()
- Fast grouping using j and by: DT[,sum(v),by=x]
- Fast ordered joins: X[Y,roll=TRUE]
- In the Introduction to data.table vignette, the data.table::order() function is SLOWER than base::order() from my Odroid xu4 (running Ubuntu 14.04.4 trusty on uSD)
odt = data.table(col=sample(1e7))
(t1 <- system.time(ans1 <- odt[base::order(col)]))  ## uses order from base R
#   user  system elapsed
#  2.730   0.210   2.947
(t2 <- system.time(ans2 <- odt[order(col)]))        ## uses data.table's order
#   user  system elapsed
#  2.830   0.215   3.052
(identical(ans1, ans2))
# [1] TRUE
- Boost Your Data Munging with R
- rbindlist(). One problem, it uses too much memory. In fact, when I try to analyze R package downloads, the command "dat <- rbindlist(logs)" uses up my 64GB memory (OS becomes unresponsive).
- Convenience features of fread
- The ultimate R data.table cheat sheet from infoworld
OpenMP enabled compiler for Mac. This instruction works on my Mac El Capitan (10.11.6) when I need to upgrade the data.table version from 1.11.4 to 1.11.6.
Question: how to make use multicore with data.table package?
dtplyr
https://www.tidyverse.org/blog/2019/11/dtplyr-1-0-0/
reshape & reshape2 (superceded by tidyr package)
- Data Shape Transformation With Reshape()
- Use acast() function in reshape2 package. It will convert data.frame used for analysis to a table-like data.frame good for display.
- http://lamages.blogspot.com/2013/10/creating-matrix-from-long-dataframe.html
tidyr
Missing values
Handling Missing Values in R using tidyr
Pivot
- tidyr package. pivot vignette,
pivot_wider()
R> d2 <- tibble(o=rep(LETTERS[1:2], each=3), n=rep(letters[1:3], 2), v=1:6); d2
# A tibble: 6 × 3
  o     n         v
  <chr> <chr> <int>
1 A     a         1
2 A     b         2
3 A     c         3
4 B     a         4
5 B     b         5
6 B     c         6
R> d1 <- d2%>% pivot_wider(names_from=n, values_from=v); d1
# A tibble: 2 × 4
  o         a     b     c
  <chr> <int> <int> <int>
1 A         1     2     3
2 B         4     5     6
R> d1 %>% pivot_longer(!o, names_to = 'n', values_to = 'v')
# Pivot all columns except 'o' column
# A tibble: 6 × 3
  o     n         v
  <chr> <chr> <int>
1 A     a         1
2 A     b         2
3 A     c         3
4 B     a         4
5 B     b         5
6 B     c         6
- In addition to the names_from and values_from columns, the data must have other columns
- For each (combination) of unique value from other columns, the values from names_from variable must be unique
- Conversion from gather() to pivot_longer()
gather(df, key=KeyName, value = valueName, col1, col2, ...) # No quotes around KeyName and valueName

pivot_longer(df, cols, names_to = "keyName", values_to = "valueName")
  # cols can be everything()
  # cols can be numerical numbers or column names
- From gather to pivot. pivot_longer()/pivot_wider()
- Data Pivoting with tidyr
- A Tidy Transcriptomics introduction to RNA-Seq analyses
data %>% pivot_longer(cols = c("counts", "counts_scaled"), names_to = "source", values_to = "abundance") - Using R: setting a colour scheme in ggplot2. Note the new (default) column names value and name after the function pivot_longer(data, cols).
set(1)
dat1 <- data.frame(y=rnorm(10), x1=rnorm(10), x2=rnorm(10))
dat2 <- pivot_longer(dat1, -y)
head(dat2, 2)
# A tibble: 2 x 3
      y name   value
  <dbl> <chr>  <dbl>
1 -1.28 x1     0.717
2 -1.28 x2    -0.320

dat3 <- pivot_wider(dat2)
range(dat1 - dat3)
- pivot_longer()’s Advantage Over gather()
- How to carry column metadata in pivot_longer
- Working with Really Wide Data
- Data Reshaping with R: From Wide to Long (and back)
Benchmark
An evolution of reshape2. It's designed specifically for data tidying (not general reshaping or aggregating) and works well with dplyr data pipelines.
- vignette("tidy-data") & Cheat sheet
- Main functions
- Reshape data: gather() & spread(). These two will be deprecated
- Break apart or combine columns/Split cells: separate() & unite()
- Handle missing: drop_na() & fill() & replace_na()
- Other functions
- tidyr::separate() function. If a cell contains many elements separated by ",", we can use this function to create more columns. The opposite function is unite().
- tidyr::separate_rows(). If a cell contains many elements separated by ",", we can use this function to create one more row. See the cheat sheet link above.
- http://blog.rstudio.org/2014/07/22/introducing-tidyr/
- http://rpubs.com/seandavi/GEOMetadbSurvey2014
- http://timelyportfolio.github.io/rCharts_factor_analytics/factors_with_new_R.html
- tidyr vs reshape2
- A tidyr Tutorial from U of Virginia
- Benchmarking cast in R from long data frame to wide matrix
Make wide tables long with gather() (see 6.3.1 of Efficient R Programming)
library(tidyr)
library(efficient)
data(pew) # wide table
dim(pew) # 18 x 10,  (religion, '<$10k', '$10--20k', '$20--30k', ..., '>150k')
pewt <- gather(data = pew, key = Income, value = Count, -religion)
dim(pew) # 162 x 3,  (religion, Income, Count)

args(gather)
# function(data, key, value, ..., na.rm = FALSE, convert = FALSE, factor_key = FALSE)
where the three arguments of gather() requires:
- data: a data frame in which column names will become row values. If the data is a matrix, use %>% as.data.frame() beforehand.
- key: the name of the categorical variable into which the column names in the original datasets are converted.
- value: the name of cell value columns
In this example, the 'religion' column will not be included (-religion).
dplyr, plyr packages
- plyr package suffered from being slow in some cases. dplyr addresses this by porting much of the computation to C++. Another additional feature is the ability to work with data stored directly in an external database. The benefits of doing this are the data can be managed natively in a relational database, queries can be conducted on that database, and only the results of query returned.
- It's amazing the things one can do in base R (without installing or loading any other #rstats packages)
- Essential functions: 3 rows functions, 3 column functions and 1 mixed function.
           select, mutate, rename, recode
            +------------------+
filter      +                  +
arrange     +                  +
group_by    +                  +
drop_na     +                  +
ungroup     + summarise        +
            +------------------+
- These functions works on data frames and tibble objects. Note stats package also has a filter() function for time series data. If we have not loaded the dplyr package, the filter() function below will give an error (count() also is from dplyr).
iris %>% filter(Species == "setosa") %>% count()
head(iris %>% filter(Species == "setosa") %>% arrange(Sepal.Length))
- dplyr tutorial from PH525x series (Biomedical Data Science by Rafael Irizarry and Michael Love). For select() function, some additional options to select columns based on a specific criteria include
- starts_with()/ ends_with() = Select columns that start/end with a character string
- contains() = Select columns that contain a character string
- matches() = Select columns that match a regular expression
- one_of() = Select columns names that are from a group of names
- Data Transformation in the book R for Data Science. Five key functions in the dplyr package:
- Filter rows: filter(). filter is faster than subset() for very large records. But subset() can both subset rows and select columns.
- Arrange rows: arrange()
- Select columns: select(). Or use $ or [[Number]] or [[NAME]].
- Add new variables: mutate()
- Grouped summaries: group_by() & summarise()
# filter
jan1 <- filter(flights, month == 1, day == 1)
filter(flights, month == 11 | month == 12)
filter(flights, arr_delay <= 120, dep_delay <= 120)
df <- tibble(x = c(1, NA, 3))
filter(df, x > 1)
filter(df, is.na(x) | x > 1)

# arrange
arrange(flights, year, month, day)
arrange(flights, desc(arr_delay))

# select
select(flights, year, month, day)
select(flights, year:day)
select(flights, -(year:day))

# mutate
flights_sml <- select(flights,
  year:day,
  ends_with("delay"),
  distance,
  air_time
)
mutate(flights_sml,
  gain = arr_delay - dep_delay,
  speed = distance / air_time * 60
)
# if you only want to keep the new variables
transmute(flights,
  gain = arr_delay - dep_delay,
  hours = air_time / 60,
  gain_per_hour = gain / hours
)

# summarise()
by_day <- group_by(flights, year, month, day)
summarise(by_day, delay = mean(dep_delay, na.rm = TRUE))

# pipe. Note summarise() can return more than 1 variable.
delays <- flights %>%
  group_by(dest) %>%
  summarise(
    count = n(),
    dist = mean(distance, na.rm = TRUE),
    delay = mean(arr_delay, na.rm = TRUE)
  ) %>%
  filter(count > 20, dest != "HNL")
flights %>%
  group_by(year, month, day) %>%
  summarise(mean = mean(dep_delay, na.rm = TRUE))
- Another example
data <- data.frame(
  name = c("Alice", "Bob", "Charlie", "David", "Eve"),
  age = c(25, 30, 35, 40, 45),
  gender = c("F", "M", "M", "M", "F"),
  score1 = c(80, 85, 90, 95, 100),
  score2 = c(75, 80, 85, 90, 95)
)

# Example usage of dplyr functions
result <- data %>%
  filter(gender == "M") %>%                # Keep only rows where gender is "M"
  select(name, age, score1) %>%            # Select specific columns
  mutate(score_diff = score1 - score2) %>% # Calculate a new column based on existing columns
  arrange(desc(age)) %>%                   # Arrange rows in descending order of age
  #group_by(gender) %>%                    # Group the data by gender
  summarize(mean_score1 = mean(score1))    # Calculate the mean of score1 for each group
- Efficient R Programming
- Data wrangling: Transformation from R-exercises.
- Express Intro to dplyr by rollingyours.
- the dot.
matrix(rnorm(12),4, 3) %>% .[1:2, 1:2]
- stringr and plyr A data.frame is pretty much a list of vectors, so we use plyr to apply over the list and stringr to search and replace in the vectors.
- https://randomjohn.github.io/r-maps-with-census-data/ dplyr and stringr are used
- 5 interesting subtle insights from TED videos data analysis in R
- What is tidy eval and why should I care?
- The Seven Key Things You Need To Know About dplyr 1.0.0
select() for columns
Select columns from a data frame
select(my_data_frame, column_one, column_two, ...)
select(my_data_frame, new_column_name = current_column, ...)
select(my_data_frame, column_start:column_end)
select(my_data_frame, index_one, index_two, ...)
select(my_data_frame, index_start:index_end)
select() + everything()
If we want one particular column (say the dependent variable y) to appear first or last in the dataset. We can use the everything().
iris %>% select(Species, everything()) %>% head()
iris %>% select(-Species, everything()) %>% head() # put Species to the last col
.$Name
Extract a column using piping. The . represents the data frame that is being piped in, and $Name extracts the ‘Name’ column.
mtcars %>% .$mpg  # A vector

mtcars %>% select(mpg) # A list
filter() for rows
mtcars %>% filter(mpg>10)

identical(mtcars %>% filter(mpg>10), subset(mtcars, mpg>10))
# [1] TRUE
filter by date
What Is the Best Way to Filter by Date in R?
arrange (reorder)
- Arrange values by a Single Variable:
# Create a sample data frame students <- data.frame( Name = c("Ali", "Boby", "Charlie", "Davdas"), Score = c(85, 92, 78, 95) ) # Arrange by Score in ascending order arrange(students, Score) # Name Score # 1 Charlie 78 # 2 Ali 85 # 3 Boby 92 # 4 Davdas 95 - Arrange values by Multiple Variables:
This is like the "sort" function in Excel.
# Create a sample data frame transactions <- data.frame( Date = c("2024-04-01", "2024-04-01", "2024-04-02", "2024-04-03"), Amount = c(100, 150, 200, 75) ) # Arrange by Date in ascending order, then by Amount in descending order arrange(transactions, Date, desc(Amount)) # Date Amount # 1 2024-04-01 150 # 2 2024-04-01 100 # 3 2024-04-02 200 # 4 2024-04-03 75 - Arrange values with Missing Values:
# Create a sample data frame with missing values
data <- data.frame(
  ID = c(1, 2, NA, 4),
  Value = c(20, NA, 15, 30)
)

# Arrange by Value in ascending order, placing missing values first
arrange(data, desc(is.na(Value)), Value)
#   ID Value
# 1  2    NA
# 2 NA    15
# 3  1    20
# 4  4    30
arrange and match
How to do the following in pipe A <- A[match(id.ref, A$id), ]
How to sort rows of a data frame based on a vector using dplyr pipe, Order data frame rows according to vector with specific order
- Data
library(dplyr)

# Create a sample dataframe 'A'
set.seed(1); A <- data.frame(
     id = sample(letters[1:5]),
     value = 1:5
     )
print(A)
  id value
1  a     1
2  d     2
3  c     3
4  e     4
5  b     5

# Create a reference vector 'id.ref'
id.ref <- c("e", "d", "c", "b", "a")
# Goal: A[match(id.ref, A$id),] id value 4 e 4 2 d 2 3 c 3 5 b 5 1 a 1
- Method 1 (best): no match() is needed. Brilliant!
A %>% arrange(factor(id, levels=id.ref))
  id value
1  e     4
2  d     2
3  c     3
4  b     5
5  a     1
# detail:
factor(A$id, levels=id.ref)
[1] a d c e b
Levels: e d c b a
- Method 2: complicated
A %>% mutate(id.match = match(id, id.ref)) %>% arrange(id.match) %>% select(-id.match) id value 1 e 4 2 d 2 3 c 3 4 b 5 5 a 1 # detail: A %>% mutate(id.match = match(id, id.ref)) id value id.match 1 a 1 5 2 d 2 2 3 c 3 3 4 e 4 1 5 b 5 4 - Method 3: a simplified version of Method 2, but it needs match()
A %>% arrange(match(id, id.ref))
  id value
1  e     4
2  d     2
3  c     3
4  b     5
5  a     1
group_by()
- ?group_by and ungroup(),
- Grouped data
- Is ungroup() recommended after every group_by()? Always ungroup() when you’ve finished with your calculations. See here or this.
- You might want to use ungroup() if you want to perform further calculations or manipulations on the data that don’t depend on the grouping. For example, after ungrouping the data, you could add new columns or filter rows without being restricted by the grouping.
                  +-- mutate() + ungroup()
x -- group_by() --|
                  +-- summarise() # reduce the dimension, no way to get back
Subset rows by group
Subset rows based on their integer locations-slice in R
Rank by Group
df %>% arrange(team, points) %>%
    group_by(team) %>%
    mutate(rank = rank(points))
group_by() + summarise(), arrange(desc())
Data transformation from R for Data Science
- group_by(var1) %>% summarise(varY = mean(var2)) %>% ggplot(aes(x = varX, y = varY, fill = varF)) + geom_bar(stat = "identity") + theme_classic()
- summarise(newvar = sum(var1) / sum(var2))
- arrange(desc(var1, var2))
- Distinct number of observation: n_distinct()
- Count the number of rows: n()
- nth observation of the group: nth()
- First observation of the group: first()
- Last observation of the group: last()
group_by() + summarise() + across()
group_by() + nest(), mutate(, map()), unnest(), list-columns
nest(data=) is a function in the tidyr package in R that allows you to create nested data frames, where one column contains another data frame or list. This is useful when you want to perform analysis or visualization on each group separately. PS: it seems group_by() is not needed.
histogram <- gss_cat |>
  nest(data = -marital) |>  # OR nest(.by = marital). 6x2 tibble. Col1=marital, col2=data.
  mutate(
    histogram = pmap(
      .l = list(marital, data),
      .f = \(marital, data) {
        ggplot(data, aes(x = tvhours)) +
          geom_histogram(binwidth = 1) +
          labs(
            title = marital
          )
      }
    )
  )
histogram$histogram[[1]]
Many models from R for Data Science
- ?unnest, vignette('rectangle'), vignette('nest') & vignette('pivot')
tibble(x = 1:2, y = list(1:4, 2:3)) %>% unnest(y) %>% group_by(x) %>% nest()
# returns to tibble(x = 1:2, y = list(1:4, 2:3)) with 'groups' information
- annotate boxplot in ggplot2
- Coding in R: Nest and map your way to efficient code
      group_by() + nest()    mutate(, map())   unnest()
data  -------------------->  --------------->  ------->
install.packages('gapminder'); library(gapminder) gapminder_nest <- gapminder %>% group_by(country) %>% nest() # country, data # each row of 'data' is a tibble gapminder_nest$data[[1]] # tibble 57 x 8 gapminder_nest <- gapminder_nest %>% mutate(pop_mean = map(.x = data, ~mean(.x$pop, na.rm = T))) # country, data, pop_mean gapminder_nest %>% unnest(pop_mean) # country, data, pop_mean gapminder_plot <- gapminder_nest %>% unnest(pop_mean) %>% select(country, pop_mean) %>% ungroup() %>% top_n(pop_mean, n = -10) %>% mutate(pop_mean = pop_mean/10^3) gapminder_plot %>% ggplot(aes(x = reorder(country, pop_mean), y = pop_mean)) + geom_point(colour = "#FF6699", size = 5) + geom_segment(aes(xend = country, yend = 0), colour = "#FF6699") + geom_text(aes(label = round(pop_mean, 0)), hjust = -1) + theme_minimal() + labs(title = "Countries with smallest mean population from 1960 to 2016", subtitle = "(thousands)", x = "", y = "") + theme(legend.position = "none", axis.text.x = element_blank(), plot.title = element_text(size = 14, face = "bold"), panel.grid.major.y = element_blank()) + coord_flip() + scale_y_continuous() - Tidy analysis from tidymodels
- Is nest() + mutate() + map() + unnest() really the best alternative to dplyr::do()
across()
- ?across. Applying a function or operation to multiple columns in a data frame simultaneously.
across(.cols, .fns, ..., .names = NULL, .unpack = FALSE)
gdf <-
  tibble(g = c(1, 1, 2, 3), v1 = 10:13, v2 = 20:23) %>%
  group_by(g)
gdf %>% mutate(across(v1:v2, ~ .x + rnorm(1)))
#>       g    v1    v2
#>   <dbl> <dbl> <dbl>
#> 1     1  10.3  20.7
#> 2     1  11.3  21.7
#> 3     2  11.2  22.6
#> 4     3  13.5  22.7
- dplyr across: First look at a new Tidyverse function.
- Apply a function (or functions) across multiple columns. across(), if_any(), if_all().
- Select variables that match a pattern. starts_with(), ends_with(), contains(), matches(), num_range().
- data %>% group_by(Var1) %>% summarise(across(contains("SomeKey"), mean, na.rm = TRUE))
ny <- filter(cases, State == "NY") %>%
  select(County = `County Name`, starts_with(c("3", "4")))

daily_totals <- ny %>%
  summarize(
    across(starts_with("4"), sum)
  )

median_and_max <- list(
  med = ~median(.x, na.rm = TRUE),
  max = ~max(.x, na.rm = TRUE)
)

april_median_and_max <- ny %>%
  summarize(
    across(starts_with("4"), median_and_max)
  )
</pre>
<pre>
# across(.cols = everything(), .fns = NULL, ..., .names = NULL)

# Rounding the columns Sepal.Length and Sepal.Width
iris %>%
  as_tibble() %>%
  mutate(across(c(Sepal.Length, Sepal.Width), round))

iris %>% summarise(across(contains("Sepal"), ~mean(.x, na.rm = TRUE)))

# filter rows
iris %>% filter(if_any(ends_with("Width"), ~ . > 4))

iris %>% select(starts_with("Sepal"))

iris %>% select(starts_with(c("Petal", "Sepal")))

iris %>% select(contains("Sepal"))
ave() - Adding a column of means by group to original data
mutate vs tapply
mutate + replace() or ifelse()
- mutate() is similar to base::within()
- Change value of variable with dplyr
mtcars %>% mutate(mpg=replace(mpg, cyl==4, NA)) %>% as.data.frame() # VS mtcars$mpg[mtcars$cyl == 4] <- NA - using ifelse()
- using case_when()
- Mutate multiple columns
- Apply the mutate function to multiple columns at once | mutate_at / mutate_all / mutate_if
mutate_at(data, .vars = vars(starts_with("Petal")), .funs = ~ . * 2) %>% head() mutate_at(data, .vars = vars(starts_with("Petal")), `*`, 2) %>% head() - recode()
char_vec <- sample(c("a", "b", "c"), 10, replace = TRUE)
recode(char_vec, a = "Apple", b = "Banana", .default = NA_character_)
Hash table
- Create new column based on 4 values in another column. The trick is to create a named vector; like a Dictionary in Python.
Here is my example:
hashtable <- data.frame(value=1:4, key=c("B", "C", "A", "D"))
input <- c("A", "B", "C", "D", "B", "B", "A", "A") # input to be matched with keys,
                                                   # this could be very long
# Trick: convert the hash table into a named vector
htb <- hashtable$value; names(htb) <- hashtable$key

# return the values according to the names
out <- htb[input]; out
A B C D B B A A
3 1 2 4 1 1 3 3
We can implement using Python by creating a variable of dictionary type/structure.
hashtable = {'B': 1, 'C': 2, 'A': 3, 'D': 4}
input = ['A', 'B', 'C', 'D', 'B', 'B', 'A', 'A']
out = [hashtable[key] for key in input]
Or using C
#include <stdio.h> int main() { int hashtable[4] = {3, 1, 2, 4}; char input[] = {'A', 'B', 'C', 'D', 'B', 'B', 'A', 'A'}; int out[sizeof(input)/sizeof(input[0])]; for (int i = 0; i < sizeof(input)/sizeof(input[0]); i++) { out[i] = hashtable[input[i] - 'A']; } for (int i = 0; i < sizeof(out)/sizeof(out[0]); i++) { printf("%d ", out[i]); } printf("\n"); return 0; } - hash package
- digest package
inner_join, left_join, full_join
- Mutating joins
- Join Data Frames with the R dplyr Package (9 Examples)
- Join in r: how to join (merge) data frames (inner, outer, left, right) in R
- Dplyr Tutorial: Merge and Join Data in R with Examples
plyr::rbind.fill()
Videos
- Hands-on dplyr tutorial for faster data manipulation in R by Data School. At time 17:00, it compares the %>% operator, with() and aggregate() for finding group mean.
- https://youtu.be/aywFompr1F4 (shorter video) by Roger Peng
- https://youtu.be/8SGif63VW6E by Hadley Wickham
- Tidy eval: Programming with dplyr, tidyr, and ggplot2. Bang bang "!!" operator was introduced for use in a function call.
- JULIA SILGE
- “Do More with R” video tutorials by Sharon Machlis
- Learning the R Tidyverse from lynda.com
dbplyr
- https://dbplyr.tidyverse.org/articles/dbplyr.html
- translate_sql() Translate an R expression to sql. Some examples.
stringr
- stringr is part of the tidyverse but is not a core package. You need to load it separately.
- Handling Strings with R(ebook) by Gaston Sanchez.
- https://www.rstudio.com/wp-content/uploads/2016/09/RegExCheatsheet.pdf
- stringr Cheat sheet (2 pages, this will immediately download the pdf file)
- Detect Matches: str_detect(), str_which(), str_count(), str_locate()
- Subset: str_sub(), str_subset(), str_extract(), str_match()
- Manage Lengths: str_length(), str_pad(), str_trunc(), str_trim()
- Mutate Strings: str_sub(), str_replace(), str_replace_all(), str_remove()
- Case Conversion: str_to_lower(), str_to_upper(), str_to_title()
- Joint and Split: str_c(), str_dup(), str_split_fixed(), str_glue(), str_glue_date()
- Efficient data carpentry → Regular expressions from Efficient R programming book by Gillespie & Lovelace.
- Common functions:
`stringr` Function Description Base R Equivalent `str_length()` Returns the number of characters in each element of a character vector. `nchar()` `str_sub()` Extracts substrings from a character vector. `substr()` `str_trim()` Removes leading and trailing whitespace from strings. `trimws()` `str_split()` Splits a string into pieces based on a delimiter. `strsplit()` `str_replace()` Replaces occurrences of a pattern in a string with another string. `gsub()` `str_detect()` Detects whether a pattern is present in each element of a character vector. `grepl()` `str_subset()` Returns the elements of a character vector that contain a pattern. `grep()` `str_count()` Counts the number of occurrences of a pattern in each element of a character vector. `gregexpr()` and `lengths()`
str_replace()
Replace a string in a column: dplyr::across() & str_replace()
df <- data.frame(country=c('India', 'USA', 'CHINA', 'Algeria'),
                 position=c('1', '1', '2', '3'),
                 points=c(22, 25, 29, 13))

df %>%
  mutate(across('country', str_replace, 'India', 'Albania'))

df %>%
  mutate(across('country', str_replace, 'A|I', ''))
split
Split Data Frame Variable into Multiple Columns in R (3 Examples)
Three ways:
- base::strsplit(x, CHAR)
- stringr::str_split_fixed(x, CHAR, 2)
- tidyr::separate(x, c("NewVar1", "NewVar2"), CHAR)
x <- c("a-1", "b-2", "c-3")

stringr::str_split_fixed(x, "-", 2)
#      [,1] [,2]
# [1,] "a"  "1"
# [2,] "b"  "2"
# [3,] "c"  "3"

tidyr::separate(data.frame(x), x, c('x1', 'x2'), "-")
   # The first argument must be a data frame
   # The 2nd argument is the column names
#   x1 x2
# 1  a  1
# 2  b  2
# 3  c  3
magrittr: pipe
- Vignettes
- How does the pipe operator actually work?
- magrittr and wrapr Pipes in R, an Examination. Instead of nested statements, it is using pipe operator %>%. So the code is easier to read. Impressive!
x %>% f     # f(x)
x %>% f(y)  # f(x, y)
x %>% f(arg=y)  # f(x, arg=y)
x %>% f(z, .) # f(z, x)
x %>% f(y) %>% g(z)  #  g(f(x, y), z)

x %>% select(which(colSums(!is.na(.))>0))  # remove columns with all missing data
x %>% select(which(colSums(!is.na(.))>0)) %>% filter((rowSums(!is.na(.))>0)) # remove all-NA columns _and_ rows
suppressPackageStartupMessages(library("dplyr"))
starwars %>%
  filter(., height > 200) %>%
  select(., height, mass) %>%
  head(.)
# instead of
starwars %>%
  filter(height > 200) %>%
  select(height, mass) %>%
  head
iris$Species
iris[["Species"]]

iris %>%
`[[`("Species")

iris %>%
`[[`(5)

iris %>%
  subset(select = "Species")
- Split-apply-combine: group + summarize + sort/arrange + top n. The following example is from Efficient R programming.
data(wb_ineq, package = "efficient")
wb_ineq %>%
  filter(grepl("g", Country)) %>%
  group_by(Year) %>%
  summarise(gini = mean(gini, na.rm  = TRUE)) %>%
  arrange(desc(gini)) %>%
  top_n(n = 5)
- Writing Pipe-friendly Functions
- http://rud.is/b/2015/02/04/a-step-to-the-right-in-r-assignments/
- http://rpubs.com/tjmahr/pipelines_2015
- http://danielmarcelino.com/i-loved-this-crosstable/
- http://moderndata.plot.ly/using-the-pipe-operator-in-r-with-plotly/
- RMSE
f <- function(x) {
  (y - x) %>%
    '^'(2) %>%
    sum %>%
    '/'(length(x)) %>%
    sqrt %>%
    round(2)
}
# Examples from R for Data Science-Import, Tidy, Transform, Visualize, and Model
diamonds <- ggplot2::diamonds
diamonds2 <- diamonds %>% dplyr::mutate(price_per_carat = price / carat)

pryr::object_size(diamonds)
pryr::object_size(diamonds2)
pryr::object_size(diamonds, diamonds2)

rnorm(100) %>% matrix(ncol = 2) %>% plot() %>% str()
rnorm(100) %>% matrix(ncol = 2) %T>% plot() %>% str() # 'tee' pipe
    # %T>% works like %>% except that it returns the lefthand side (rnorm(100) %>% matrix(ncol = 2))
    # instead of the righthand side.

# If a function does not have a data frame based api, you can use %$%.
# It explodes out the variables in a data frame.
mtcars %$% cor(disp, mpg)

# For assignment, magrittr provides the %<>% operator
mtcars <- mtcars %>% transform(cyl = cyl * 2) # can be simplified by
mtcars %<>% transform(cyl = cyl * 2)
- The Four Pipes of magrittr and lambda functions.
Upsides of using magrittr: no need to create intermediate objects, code is easy to read.
When not to use the pipe
- your pipes are longer than (say) 10 steps
- you have multiple inputs or outputs
- Functions that use the current environment: assign(), get(), load()
- Functions that use lazy evaluation: tryCatch(), try()
Dollar sign .$
- A Short Tutorial about Magrittr’s Pipe Operator and Placeholders, Simplify Your Code with %>%
gapminder %>% dplyr::filter(continent == "Asia") %>% {stats::cor(.$lifeExp, .$gdpPercap)} gapminder %>% dplyr::filter(continent == "Asia") %$% {stats::cor(lifeExp, gdpPercap)} gapminder %>% dplyr::mutate(continent = ifelse(.$continent == "Americas", "Western Hemisphere", .$continent)) - Another example Introduction to the msigdbr package
m_list  = m_df %>% split(x = .$gene_symbol, f = .$gs_name)
m_list2 = m_df %$% split(x = gene_symbol, f = gs_name)
all.equal(m_list, m_list2)
# [1] TRUE
- Use $ dollar sign at end of of an R magrittr pipeline to return a vector
DF %>% filter(y > 0) %>% .$y
%$%
Expose the names in lhs to the rhs expression. This is useful when functions do not have a built-in data argument.
lhs %$% rhs
# lhs:	A list, environment, or a data.frame.
# rhs: An expression where the names in lhs is available.

iris %>%
  subset(Sepal.Length > mean(Sepal.Length)) %$%
  cor(Sepal.Length, Sepal.Width)
set_rownames() and set_colnames()
https://stackoverflow.com/a/56613460, https://www.rdocumentation.org/packages/magrittr/versions/1.5/topics/extract
data.frame(x=1:5, y=2:6) %>% magrittr::set_rownames(letters[1:5])

cbind(1:5, 2:6) %>% magrittr::set_colnames(letters[1:2])
match()
a <- 1:3
id <- letters[1:3]
set.seed(1234); id.ref <- sample(id)
id # [1] "b" "c" "a"

a[match(id.ref, b)] # [1] 2 3 1
id.ref %>% match(b) %>% `[`(a, .) # Same, but complicated
dtrackr
dtrackr: Track your Data Pipelines
purrr: : Functional Programming Tools
While there is nothing fundamentally wrong with the base R apply functions, the syntax is somewhat inconsistent across the different apply functions, and the expected type of the object they return is often ambiguous (at least it is for sapply…). See Learn to purrr.
- https://purrr.tidyverse.org/
- Chap 21 Iteration from R for Data Science book
- cheatsheet
- purrr cookbook
- Higher-order function
- Python Decorator/metaprogramming
- Iterating over the lines of a data.frame with purrr
- Functional programming (cf Object-Oriented Programming)
- What does the tilde mean in this context of R code, What is meaning of first tilde in purrr::map
- Getting started with the purrr package in R, especially the map() and map_df() functions.
library(purrr)
# map() is a replacement of lapply()
# lapply(dat, function(x) mean(x$Open))
map(dat, function(x)mean(x$Open))

# map allows us to bypass the function function.
# Using a tilda (~) in place of function and a dot (.) in place of x
map(dat, ~mean(.$Open))

# map allows you to specify the structure of your output.
map_dbl(dat, ~mean(.$Open))

# map2() is a replacement of mapply()
# mapply(function(x,y)plot(x$Close, type = "l", main = y), x = dat, y = stocks)
map2(dat, stocks, ~plot(.x$Close, type="l", main = .y))
- map_dfr() function from "The Joy of Functional Programming (for Data Science)" with Hadley Wickham. It can be used to replace a loop.
data <- map(paths, read.csv)
data <- map_dfr(paths, read.csv, id = "path")

out1 <- mtcars %>% map_dbl(mean, na.rm = TRUE)
out2 <- mtcars %>% map_dbl(median, na.rm = TRUE)
- Purr yourself into a math genius
- Write & Read Multiple Excel files with purrr
- Handling errors using purrr's possibly() and safely()
- How to Automate Exploratory Analysis Plots
- Easy error handling in R with purrr’s possibly
- Learn to purrr. Lots of good information like tilde-dot is a shorthand for functions.
function(x) { x + 10 } # is the same as ~{.x + 10} map_dbl(c(1, 4, 7), ~{.x + 10}) - A closer look at replicate() and purrr::map() for simulations
twogroup_fun = function(nrep = 10, b0 = 5, b1 = -2, sigma = 2) { ngroup = 2 group = rep( c("group1", "group2"), each = nrep) eps = rnorm(ngroup*nrep, 0, sigma) growth = b0 + b1*(group == "group2") + eps growthfit = lm(growth ~ group) growthfit } sim_lm = replicate(5, twogroup_fun(), simplify = FALSE ) str(sim_lm, max.level = 1) map_dbl(sim_lm, ~summary(.x)$r.squared) # Same as function(x) {} style map_dbl(sim_lm, function(x) summary(x)$r.squared) # Same as sapply() sapply(sim_lm, function(x) summary(x)$r.squared) map_dfr(sim_lm, broom::tidy, .id = "model") - Functional programming from Advanced R.
- Functional Programming : Sara Altman, Bill Behrman, Hadley Wickham
- Some learnings from functional programming you can use to write safer programs
map() and map_dbl()
- Mastering the map() Function in R
- An example from https://purrr.tidyverse.org/
mtcars |> split(mtcars$cyl) |> # from base R map(\(df) lm(mpg ~ wt, data = df)) |> map(summary) |> map_dbl("r.squared") # 4 6 8 # 0.5086326 0.4645102 0.4229655 - Solution by base R lapply() and sapply(). See the article purrr <-> base R
mtcars |>
     split(mtcars$cyl) |>
     lapply(function(df) lm(mpg ~ wt, data = df)) |>
     lapply(summary) |>
     sapply(function(x) x$r.squared)
#         4         6         8
# 0.5086326 0.4645102 0.4229655
tilde
- The lambda syntax and tilde notation provided by purrr allow you to write concise and readable anonymous functions in R.
x <- 1:3
map_dbl(x, ~ .x^2)  # [1] 1 4 9
- The notation ~ .x^2 is equivalent to writing function(.x) .x^2 or function(z) z^2 or \(y) y^2
x <- list(a = 1:3, b = 4:6)
y <- list(a = 10, b = 100)
map2_dbl(x, y, ~ sum(.x * .y))
#   a    b
#  60 1500
- https://dplyr.tidyverse.org/reference/funs.html
- Use of ~ (tilde) in R programming Language (Hint: creating a formula object)
- What is meaning of first tilde in purrr::map & the blog What Is Meaning of First Tilde in Purrr::Map
- Meaning of tilde and dot notation in dplyr
- Learn to purrr 2019
- dplyr piping data - difference between `.` and `.x`
- Use of Tilde (~) and period (.) in R
.x symbol
- It is used with functions like purrr::map. In the context of an anonymous function, .x is a placeholder for the first argument of the function.
- For a single argument function, you can use .. For example, ~ . + 2 is equivalent to function(.) {. + 2}.
- For a two argument function, you can use .x and .y. For example, ~ .x + .y is equivalent to function(.x, .y) {.x + .y}.
- For more arguments, you can use ..1, ..2, ..3, etc
# Create a vector
vec <- c(1, 2, 3)

# Use purrr::map with an anonymous function
result <- purrr::map(vec, ~ .x * 2)

# Print the result
print(result)
[[1]]
[1] 2

[[2]]
[1] 4

[[3]]
[1] 6
- dplyr piping data - difference between `.` and `.x`
- Function argument naming conventions (`.x` vs `x`). Se purrr::map
negate()
How to select non-numeric columns using dplyr::select_if
library(tidyverse)
iris %>% select_if(negate(is.numeric))
pmap()
?pmap - Map over multiple input simultaneously (in "parallel")
# Create two lists with multiple elements
list1 <- list(1, 2, 3)
list2 <- list(10, 20, 30)

# Define a function to add the elements of each list
my_func <- function(x, y) {
  x + y
}

# Use pmap to apply the function to each element of the lists in parallel
result <- pmap(list(list1, list2), my_func); result
[[1]]
[1] 11

[[2]]
[1] 22

[[3]]
[1] 33
A more practical example when we want to run analysis or visualization on each element of some group/class variable. nest() + pmap().
# Create a data frame
df <- mpg %>%
  filter(manufacturer %in% c("audi", "volkswagen")) %>%
  select(manufacturer, year, cty)

# Nest the data by manufacturer
df_nested <- df %>%
  nest(data = -manufacturer)

# Create a function that takes a data frame and creates a ggplot object
my_plot_func <- function(data, manuf) {
     ggplot(data, aes(x = year, y = cty)) +
         geom_point() +
         ggtitle(manuf)
 }

# Use pmap to apply the function to each element of the list-column in df_nested
df_nested_plot <- df_nested %>%
     mutate(plot = pmap(list(data, manufacturer), my_plot_func))

df_nested_plot[[1]]
Another example: fitting regressions for data in each group
library(tidyverse)

# create example data
data <- tibble(
  x = rnorm(100),
  y = rnorm(100),
  group = sample(c("A", "B", "C"), 100, replace = TRUE)
)

# create a nested dataframe
nested_data <- data %>%
  nest(data = -group)

# define a function that runs linear regression on each dataset
lm_func <- function(data) {
  lm(y ~ x, data = data)
}

# apply lm_func() to each row of the nested dataframe
results <- nested_data %>%
  mutate(model = pmap(list(data), lm_func))
reduce
Reducing my for loop usage with purrr::reduce()
filter, subset data
Four Filters for Functional (Programming) Friends
purrr vs base R
https://purrr.tidyverse.org/dev/articles/base.html
forcats
https://forcats.tidyverse.org/
JAMA retraction after miscoding – new Finalfit function to check recoding
outer()
Genomic sequence
- chartr
> yourSeq <- "AAAACCCGGGTTTNNN"
> chartr("ACGT", "TGCA", yourSeq)
[1] "TTTTGGGCCCAAANNN"
broom
- broom: Convert Statistical Analysis Objects into Tidy Tibbles
- Especially the tidy() function.
R> str(survfit(Surv(time, status) ~ x, data = aml)) List of 17 $ n : int [1:2] 11 12 $ time : num [1:20] 9 13 18 23 28 31 34 45 48 161 ... $ n.risk : num [1:20] 11 10 8 7 6 5 4 3 2 1 ... $ n.event : num [1:20] 1 1 1 1 0 1 1 0 1 0 ... ... R> tidy(survfit(Surv(time, status) ~ x, data = aml)) # A tibble: 20 x 9 time n.risk n.event n.censor estimate std.error conf.high conf.low strata <dbl> <dbl> <dbl> <dbl> <dbl> <dbl> <dbl> <dbl> <chr> 1 9 11 1 0 0.909 0.0953 1 0.754 x=Maintained 2 13 10 1 1 0.818 0.142 1 0.619 x=Maintained ... 18 33 3 1 0 0.194 0.627 0.664 0.0569 x=Nonmaintained 19 43 2 1 0 0.0972 0.945 0.620 0.0153 x=Nonmaintained 20 45 1 1 0 0 Inf NA NA x=Nonmaintained - Tables from journal papers
- Multiple univariate models
library(tidyverse) library(broom) mtcars %>% select(-mpg) %>% names() %>% map_dfr(~ tidy(lm(as.formula(paste("mpg ~", .x)), data = mtcars))) # A tibble: 20 × 5 # term estimate std.error statistic p.value # <chr> <dbl> <dbl> <dbl> <dbl> # 1 (Intercept) 37.9 2.07 18.3 8.37e-18 # 2 cyl -2.88 0.322 -8.92 6.11e-10 # 3 (Intercept) 29.6 1.23 24.1 3.58e-21 # 4 disp -0.0412 0.00471 -8.75 9.38e-10 - Multivariate model
lm(mpg ~ ., data = mtcars) |> tidy()
# A tibble: 11 × 5
#   term        estimate std.error statistic p.value
#   <chr>          <dbl>     <dbl>     <dbl>   <dbl>
# 1 (Intercept)  12.3      18.7        0.657  0.518
# 2 cyl          -0.111     1.05      -0.107  0.916
# 3 disp          0.0133    0.0179     0.747  0.463
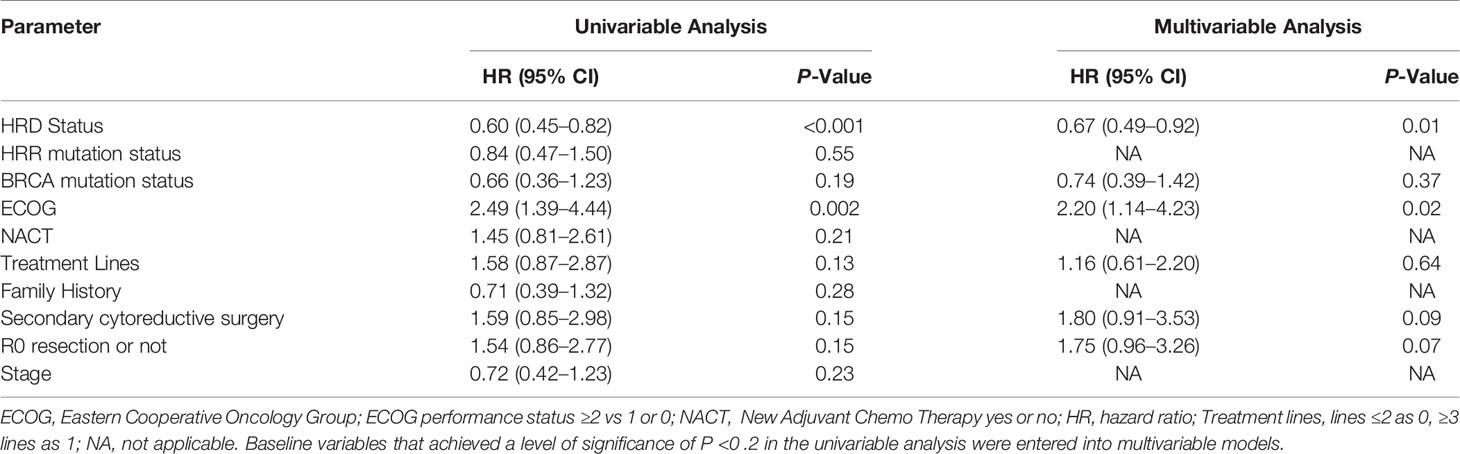
lobstr package - dig into the internal representation and structure of R objects
Other packages
Great R packages for data import, wrangling, and visualization
Great R packages for data import, wrangling, and visualization
cli package
tidytext
https://juliasilge.shinyapps.io/learntidytext/
tidytuesdayR
- https://github.com/rfordatascience/tidytuesday
- https://cran.r-project.org/web/packages/tidytuesdayR/index.html, Github
install.packages("tidytuesdayR")
library("tidytuesdayR")
tt_datasets(2020)  # get the exact day of the data we want to load
coffee_ratings <- tt_load("2020-07-07")
print(coffee_ratings)  #  readme(coffee_ratings)