File:Filtered R mean.png
Jump to navigation
Jump to search

Size of this preview: 558 × 600 pixels. Other resolution: 1,020 × 1,096 pixels.
Original file (1,020 × 1,096 pixels, file size: 68 KB, MIME type: image/png)
Summary
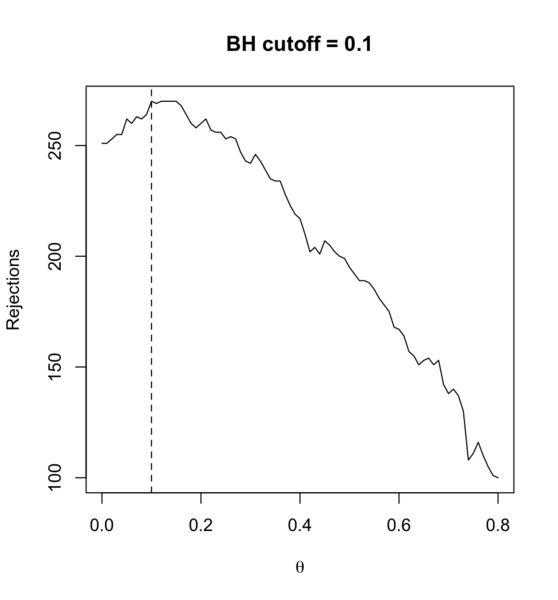
Use sample mean instead of variance for each gene as the filter statistic.
# Follow the previous code chunks
M2 <- rowMeans(exprs(ALL_bcrneg))

theta <- seq(0, .80, .01)
R_BH <- filtered_R(alpha=.10, M2, p2, theta, method="BH")
which.max(R_BH)
# 10%     <---- so theta=0.1 is the optimal; only 10% genes are removed
# 11
max(R_BH)
# [1] 270

plot(theta, R_BH, type="l",
     xlab=expression(theta), ylab="Rejections",
     main="BH cutoff = 0.1")
abline(v=.1, lty=2)
File history
Click on a date/time to view the file as it appeared at that time.
| Date/Time | Thumbnail | Dimensions | User | Comment | |
|---|---|---|---|---|---|
| current | 20:17, 12 March 2024 | | 1,020 × 1,096 (68 KB) | Brb (talk | contribs) | Use sample mean instead of variance for each gene as the filter statistic. <syntaxhighlight lang='r'> # Follow the previous code chunks M2 <- rowMeans(exprs(ALL_bcrneg)) theta <- seq(0, .80, .01) R_BH <- filtered_R(alpha=.10, M2, p2, theta, method="BH") which.max(R_BH) # 10% <---- so theta=0.1 is the optimal; only 10% genes are removed # 11 max(R_BH) # [1] 270 plot(theta, R_BH, type="l", xlab=expression(theta), ylab="Rejections", main="BH cutoff = 0.1") abline(v=.1, lty=2) <... |
You cannot overwrite this file.
File usage
The following page uses this file: