File:Geomerrorbarh.png
Jump to navigation
Jump to search

No higher resolution available.
Geomerrorbarh.png (516 × 400 pixels, file size: 17 KB, MIME type: image/png)
Summary
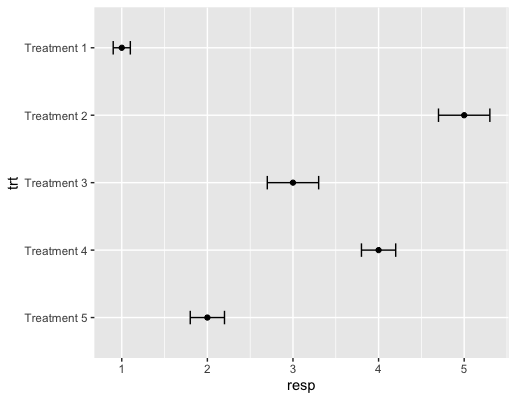
df <- data.frame(
  trt = factor(c("Treatment 1", "Treatment 2", "Treatment 3", "Treatment 4", "Treatment 5")), # treatment
  resp = c(1, 5, 3, 4, 2), # response
  se = c(0.1, 0.3, 0.3, 0.2, 0.2) # standard error
)
# make 'Treatment 1' shown at the top
df$trt <- factor(df$trt, levels = c("Treatment 5", "Treatment 4", "Treatment 3", "Treatment 2", "Treatment 1"))
p <- ggplot(df, aes(resp, trt)) + geom_point()
p + geom_errorbarh(aes(xmax=resp + se, xmin=resp-se), height=.2)
File history
Click on a date/time to view the file as it appeared at that time.
| Date/Time | Thumbnail | Dimensions | User | Comment | |
|---|---|---|---|---|---|
| current | 20:38, 15 October 2023 | | 516 × 400 (17 KB) | Brb (talk | contribs) | <syntaxhighlight lang='rsplus'> df <- data.frame( trt = factor(c("Treatment 1", "Treatment 2", "Treatment 3", "Treatment 4", "Treatment 5")), # treatment resp = c(1, 5, 3, 4, 2), # response se = c(0.1, 0.3, 0.3, 0.2, 0.2) # standard error ) # make 'Treatment 1' shown at the top df$trt <- factor(df$trt, levels = c("Treatment 5", "Treatment 4", "Treatment 3", "Treatment 2", "Treatment 1")) p <- ggplot(df, aes(resp, trt)) + geom_point() p + geom_errorbarh(aes(xmax=resp + se, xmin=resp-se),... |
You cannot overwrite this file.
File usage
The following page uses this file: