File:Glmnet4plotn.png
Jump to navigation
Jump to search
Size of this preview: 600 × 600 pixels.
Original file (800 × 800 pixels, file size: 111 KB, MIME type: image/png)
Summary
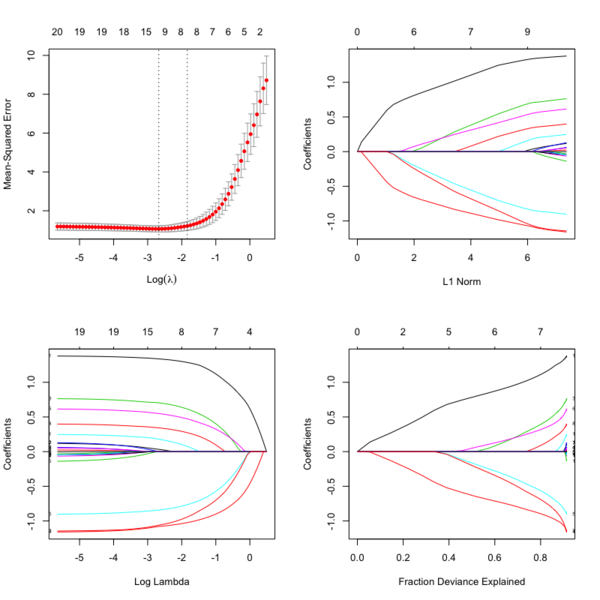
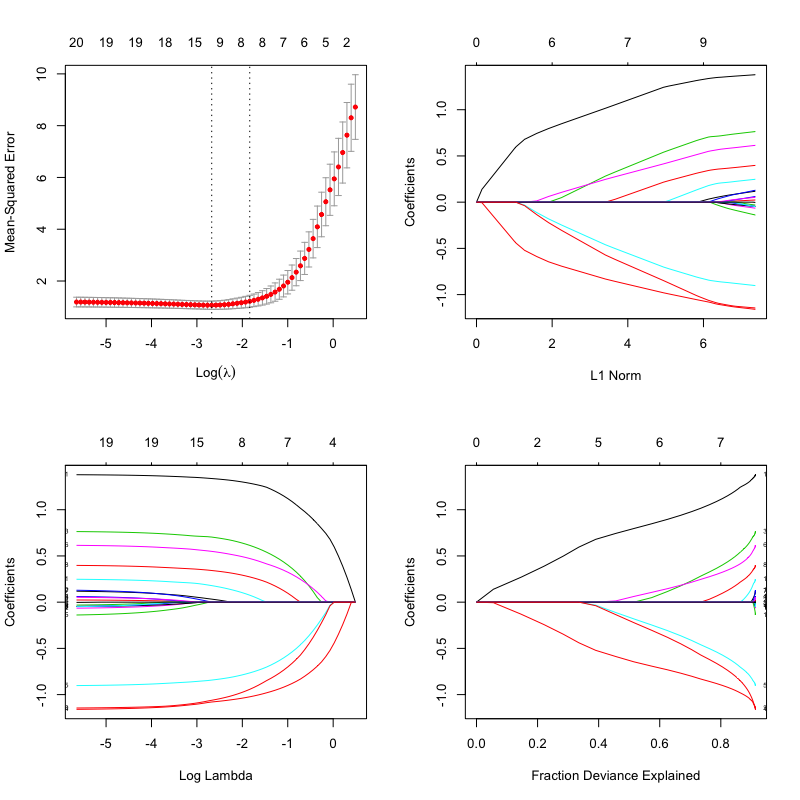
library(glmnet)
data(QuickStartExample)

cvfit = cv.glmnet(x, y)
fit = glmnet(x, y)

oldpar <- par(mfrow=c(2,2))
plot(cvfit) # mse vs log(lambda)
plot(fit) # coef vs L1 norm
plot(fit, xvar = "lambda", label = TRUE) # coef vs log(lambda)
plot(fit, xvar = "dev", label = TRUE) # coef vs Fraction Deviance Explained
par(oldpar)
File history
Click on a date/time to view the file as it appeared at that time.
| Date/Time | Thumbnail | Dimensions | User | Comment | |
|---|---|---|---|---|---|
| current | 12:11, 13 April 2020 | | 800 × 800 (111 KB) | Brb (talk | contribs) | == Summary == <syntaxhighlight lang='rsplus'> library(glmnet) data(QuickStartExample) cvfit = cv.glmnet(x, y) fit = glmnet(x, y) oldpar <- par(mfrow=c(2,2)) plot(cvfit) # mse vs log(lambda) plot(fit) # coef vs L1 norm plot(fit, xvar = "lambda", label = TRUE) # coef vs log(lambda) plot(fit, xvar = "dev", label = TRUE) # coef vs Fraction Deviance Explained par(oldpar) </syntaxhighlight> |
You cannot overwrite this file.
File usage
The following page uses this file: