File:GseaTable.png
Jump to navigation
Jump to search

No higher resolution available.
GseaTable.png (800 × 600 pixels, file size: 81 KB, MIME type: image/png)
Summary
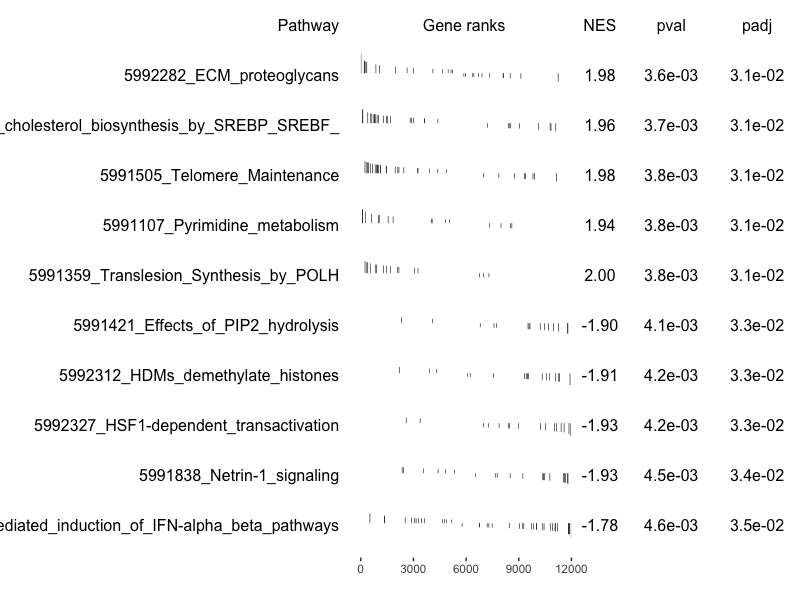
data(examplePathways)
data(exampleRanks)
fgseaRes <- fgsea(examplePathways, exampleRanks, nperm=1000,
                  minSize=15, maxSize=100)

# I pick 5 pathways with + NES and 5 pathways with - NES.
fgseaRes[order(pval), ][62:71, c('pathway', 'NES')]
#                                                             pathway       NES
# 1:                                        5992282_ECM_proteoglycans  1.984081
# 2:   5992219_Regulation_of_cholesterol_biosynthesis_by_SREBP_SREBF_  1.955961
# 3:                                     5991505_Telomere_Maintenance  1.980520
# 4:                                    5991107_Pyrimidine_metabolism  1.935453
# 5:                            5991359_Translesion_Synthesis_by_POLH  2.003523
# 6:                               5991421_Effects_of_PIP2_hydrolysis -1.904118
# 7:                                5992312_HDMs_demethylate_histones -1.909756
# 8:                           5992327_HSF1-dependent_transactivation -1.927116
# 9:                                       5991838_Netrin-1_signaling -1.928526
#10: 5991547_RIG-I_MDA5_mediated_induction_of_IFN-alpha_beta_pathways -1.784904

topPathways <- fgseaRes[order(pval),][62:71, pathway]
plotGseaTable(examplePathways[topPathways], exampleRanks,
               fgseaRes, gseaParam=0.5)
File history
Click on a date/time to view the file as it appeared at that time.
| Date/Time | Thumbnail | Dimensions | User | Comment | |
|---|---|---|---|---|---|
| current | 12:01, 12 January 2023 | | 800 × 600 (81 KB) | Brb (talk | contribs) | <pre> data(examplePathways) data(exampleRanks) fgseaRes <- fgsea(examplePathways, exampleRanks, nperm=1000, minSize=15, maxSize=100) # I pick 5 pathways with + NES and 5 pathways with - NES. fgseaRes[order(pval), ][62:71, c('pathway', 'NES')] # pathway NES # 1: 5992282_ECM_proteoglycans 1.984081 # 2: 5992219_Regulation_of_cholesterol_biosynthesis_by_SREBP_SREBF_ 1.95... |
You cannot overwrite this file.
File usage
The following page uses this file: