File:KMcurve.png
Jump to navigation
Jump to search
Size of this preview: 600 × 599 pixels. Other resolution: 672 × 671 pixels.
Original file (672 × 671 pixels, file size: 6 KB, MIME type: image/png)
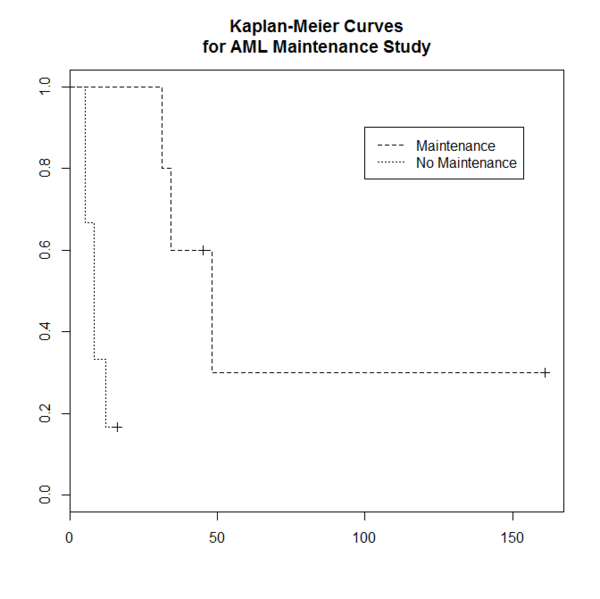
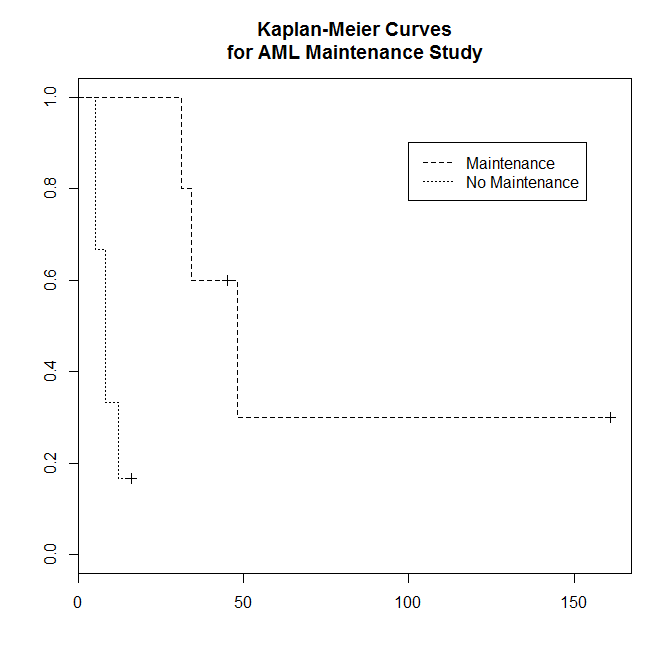
library(survival)
plot(leukemia.surv <- survfit(Surv(time, status) ~ x, data = aml[7:17,] ) , lty=2:3)
# lty=2 is dashed, 3=dotted.
legend(100, .9, c("Maintenance", "No Maintenance"), lty = 2:3)
title("Kaplan-Meier Curves\nfor AML Maintenance Study")

library(dplyr)
leukemia.surv
#Call: survfit(formula = Surv(time, status) ~ x, data = aml[7:17, ])
#
#                n events median 0.95LCL 0.95UCL
#x=Maintained    5      3     48      34      NA
#x=Nonmaintained 6      5      8       5      NA

# Note the median column does not mean we take the median from a subset of data
# The median and its confidence interval are defined by drawing a horizontal line
# at 0.5 on the plot of the survival curve and its confidence bands.
# https://www.rdocumentation.org/packages/survival/versions/3.1-12/topics/print.survfit

aml[7:17, ] %>% group_by(x) %>% summarise(median=median(time))
# A tibble: 2 x 2
  x             median
  <fct>          <dbl>
1 Maintained        45
2 Nonmaintained      8

aml[7:17, ] %>% filter(status==1) %>% group_by(x) %>% summarise(median=median(time))
# A tibble: 2 x 2
  x             median
  <fct>          <dbl>
1 Maintained        34
2 Nonmaintained      8
File history
Click on a date/time to view the file as it appeared at that time.
| Date/Time | Thumbnail | Dimensions | User | Comment | |
|---|---|---|---|---|---|
| current | 15:41, 17 December 2014 | | 672 × 671 (6 KB) | Brb (talk | contribs) | > library(survival) > plot(leukemia.surv <- survfit(Surv(time, status) ~ x, data = aml[7:17,] ) , lty=2:3) > legend(100, .9, c("Maintenance", "No Maintenance"), lty = 2:3) > title("Kaplan-Meier Curves\nfor AML Maintenance Study") |
You cannot overwrite this file.
File usage
There are no pages that use this file.