File:Rainbow default.png
Jump to navigation
Jump to search

Size of this preview: 800 × 463 pixels. Other resolution: 2,044 × 1,182 pixels.
Original file (2,044 × 1,182 pixels, file size: 426 KB, MIME type: image/png)
Summary
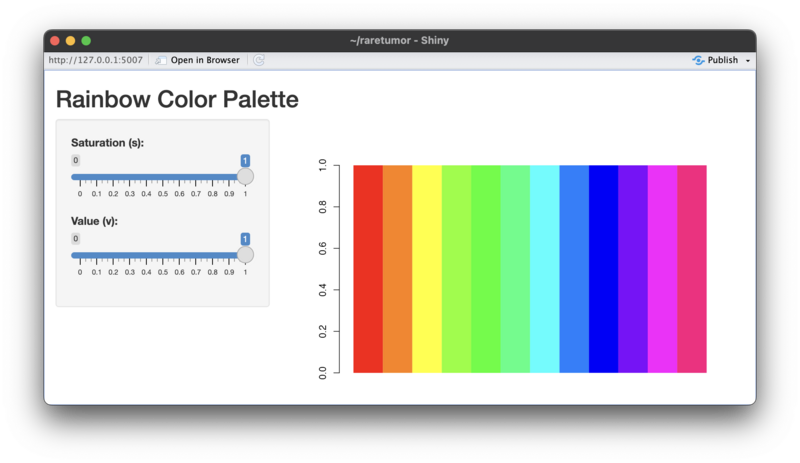
library(shiny)

# Define the UI
ui <- fluidPage(
  titlePanel("Rainbow Color Palette"),
  sidebarLayout(
    sidebarPanel(
      sliderInput("s_value", "Saturation (s):", min = 0, max = 1, value = 1, step = 0.01),
      sliderInput("v_value", "Value (v):", min = 0, max = 1, value = 1, step = 0.01)
    ),
    mainPanel(
      plotOutput("rainbow_plot")
    )
  )
)

# Define the server
server <- function(input, output) {
  output$rainbow_plot <- renderPlot({
    s <- input$s_value
    v <- input$v_value
    rainbow_colors <- rainbow(12, s = s, v = v)

    # Plot the colors
    barplot(rep(1, 12), col = rainbow_colors, border = NA, space = 0)
  })
}

# Run the Shiny app
shinyApp(ui = ui, server = server)
File history
Click on a date/time to view the file as it appeared at that time.
| Date/Time | Thumbnail | Dimensions | User | Comment | |
|---|---|---|---|---|---|
| current | 08:52, 12 March 2024 | | 2,044 × 1,182 (426 KB) | Brb (talk | contribs) | <syntaxhighlight lang='r'> library(shiny) # Define the UI ui <- fluidPage( titlePanel("Rainbow Color Palette"), sidebarLayout( sidebarPanel( sliderInput("s_value", "Saturation (s):", min = 0, max = 1, value = 1, step = 0.01), sliderInput("v_value", "Value (v):", min = 0, max = 1, value = 1, step = 0.01) ), mainPanel( plotOutput("rainbow_plot") ) ) ) # Define the server server <- function(input, output) { output$rainbow_plot <- renderPlot({ s <-... |
You cannot overwrite this file.
File usage
The following page uses this file: