File:Rerrorbars.png
Jump to navigation
Jump to search

No higher resolution available.
Rerrorbars.png (593 × 418 pixels, file size: 10 KB, MIME type: image/png)
Summary
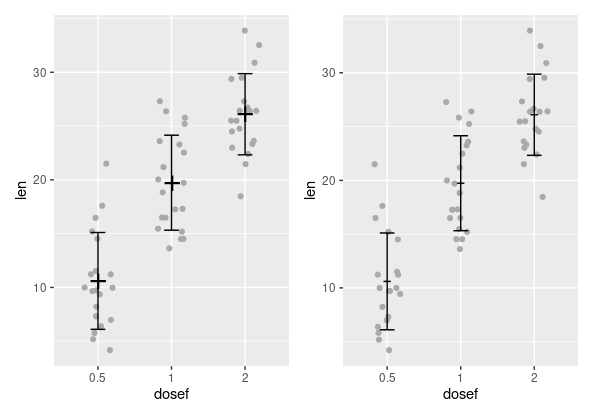
library(ggplot2)

df <- ToothGrowth
df$dosef <- as.factor(df$dose)

library(dplyr)
df.summary <- df %>%
  group_by(dosef) %>%
  summarise(
    sd = sd(len, na.rm = TRUE),
    len = mean(len)
  )
df.summary

p1 <- ggplot(df, aes(dosef, len)) +
  geom_jitter(position = position_jitter(0.2, seed=1), color = "darkgray") +
  geom_point(aes(x=dosef, y=len), shape="+", size=8, data=df.summary) +
  geom_errorbar(aes(ymin = len-sd, ymax = len+sd), width=.2, data = df.summary)

df.summary$dose <- as.numeric(df.summary$dosef)
p2 <- ggplot(df, aes(dosef, len)) +
  geom_jitter(position = position_jitter(0.2, seed=1), color = "darkgray") +
  geom_segment(aes(x=dose-.05, y=len, xend=dose+.05, yend=len), data=df.summary) +
  geom_errorbar(aes(ymin = len-sd, ymax = len+sd), width=.2, data = df.summary)

library(patchwork)
p1+p2+plot_layout(guides = "collect")
File history
Click on a date/time to view the file as it appeared at that time.
| Date/Time | Thumbnail | Dimensions | User | Comment | |
|---|---|---|---|---|---|
| current | 19:39, 24 March 2022 | | 593 × 418 (10 KB) | Brb (talk | contribs) | <pre> library(ggplot2) df <- ToothGrowth df$dosef <- as.factor(df$dose) library(dplyr) df.summary <- df %>% group_by(dosef) %>% summarise( sd = sd(len, na.rm = TRUE), len = mean(len) ) df.summary p1 <- ggplot(df, aes(dosef, len)) + geom_jitter(position = position_jitter(0.2, seed=1), color = "darkgray") + geom_point(aes(x=dosef, y=len), shape="+", size=8, data=df.summary) + geom_errorbar(aes(ymin = len-sd, ymax = len+sd), width=.2, data = df.summary) df.summary$dose <... |
You cannot overwrite this file.
File usage
The following page uses this file: