File:Scatterhist.svg
Jump to navigation
Jump to search


Size of this PNG preview of this SVG file: 563 × 563 pixels. Other resolution: 2,048 × 2,048 pixels.
Original file (SVG file, nominally 563 × 563 pixels, file size: 70 KB)
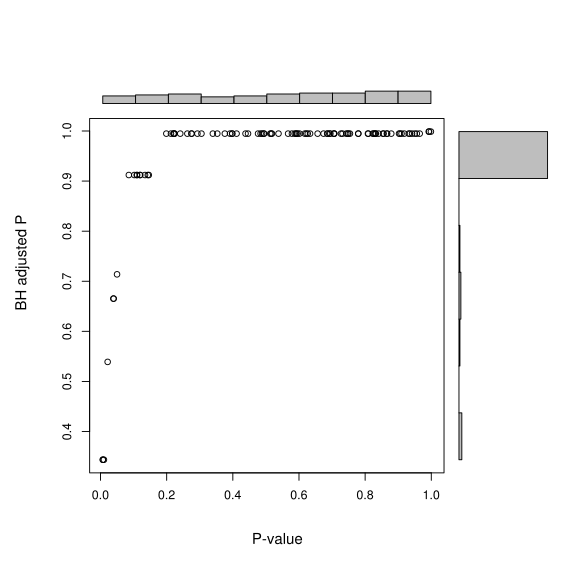
scatterhist <- function(x, y, xlab="", ylab=""){
    zones=matrix(c(2,0,1,3), ncol=2, byrow=TRUE)
    layout(zones, widths=c(4/5,1/5), heights=c(1/5,4/5))
    xhist = hist(x, plot=FALSE)
    yhist = hist(y, plot=FALSE)
    top = max(c(xhist$counts, yhist$counts))
    par(mar=c(3,3,1,1))
    plot(x,y)
    par(mar=c(0,3,1,1))
    barplot(xhist$counts, axes=FALSE, ylim=c(0, top), space=0)
    par(mar=c(3,0,1,1))
    barplot(yhist$counts, axes=FALSE, xlim=c(0, top), space=0, horiz=TRUE)
    par(oma=c(3,3,0,0))
    mtext(xlab, side=1, line=1, outer=TRUE, adj=0,
          at=.4)
    mtext(ylab, side=2, line=1, outer=TRUE, adj=0,
          at=.4)
}

library(limma)
set.seed(1234)
n <- 100
testexpr <- matrix(rnorm(n * 10, 5, 1), nc= 10)

design3 <- model.matrix(~ 0 + as.factor(c(rep(1,5), rep(2, 5))))
colnames(design3) <- c("A", "B")

fit3 <- lmFit(testexpr,design3)
contrasts.matrix3 <- makeContrasts("AvsB"=A-B, levels = design3)
fit3 <- eBayes(contrasts.fit(fit3, contrasts=contrasts.matrix3))

t3 <- topTable(fit3,coef=1, number = Inf)
with(t3, scatterhist(P.Value, adj.P.Val, xlab = "P-value", ylab = "BH adjusted P"))
File history
Click on a date/time to view the file as it appeared at that time.
| Date/Time | Thumbnail | Dimensions | User | Comment | |
|---|---|---|---|---|---|
| current | 13:33, 1 October 2018 | | 563 × 563 (70 KB) | Brb (talk | contribs) | The R source code is at https://gist.github.com/arraytools/7005670b9d4b34e45f45131a6f87d8f4#file-scatterhist_null |
| 13:21, 1 October 2018 |  | 563 × 563 (70 KB) | Brb (talk | contribs) | scatterhist <- function(x, y, xlab="", ylab=""){ zones=matrix(c(2,0,1,3), ncol=2, byrow=TRUE) layout(zones, widths=c(4/5,1/5), heights=c(1/5,4/5)) xhist = hist(x, plot=FALSE) yhist = hist(y, plot=FALSE) top = max(c(xhist$counts, yhi... |
You cannot overwrite this file.
File usage
There are no pages that use this file.