File:Twoway.png

Size of this preview: 800 × 600 pixels. Other resolution: 2,400 × 1,800 pixels.
Original file (2,400 × 1,800 pixels, file size: 76 KB, MIME type: image/png)
Summary
png("~/Downloads/twoway.png", width=8, height=6, units="in",res=300)
par(mar = c(8, 4, 4, 2))
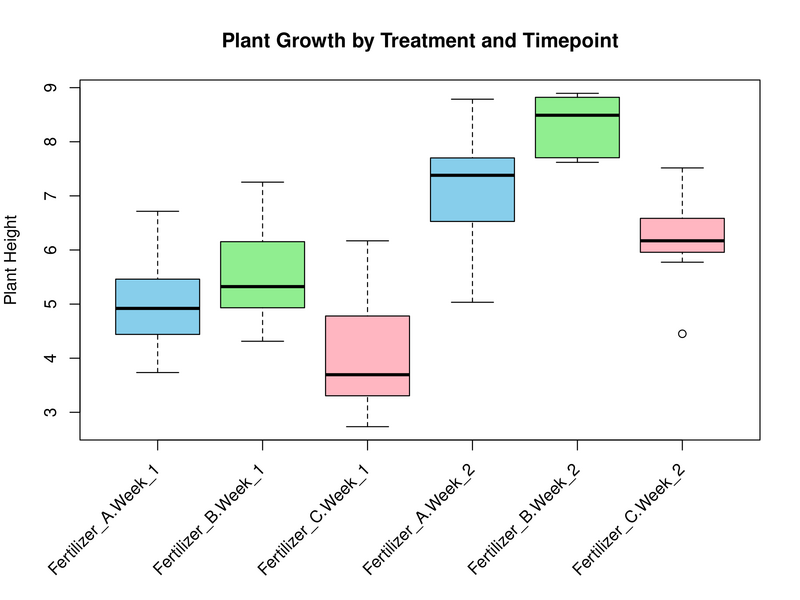
boxplot(y ~ treatment * timepoint, data = df,
col = c("skyblue", "lightgreen", "lightpink"),
main = "Plant Growth by Treatment and Timepoint",
xlab = "", ylab = "Plant Height", xaxt = "n")
# Add rotated x-axis labels
labels <- levels(interaction(df$treatment, df$timepoint))
axis(1, at = 1:length(labels), labels = FALSE) # Add ticks without labels
text(x = 1:length(labels), y = par("usr")[3] - 0.5,
labels = labels, srt = 45, adj = 1, xpd = TRUE)
dev.off()
File history
Click on a date/time to view the file as it appeared at that time.
| Date/Time | Thumbnail | Dimensions | User | Comment | |
|---|---|---|---|---|---|
| current | 20:47, 17 May 2025 | | 2,400 × 1,800 (76 KB) | Brb (talk | contribs) | <syntaxhighlight lang='r'> png("~/Downloads/twoway.png", width=8, height=6, units="in",res=300) par(mar = c(8, 4, 4, 2)) boxplot(y ~ treatment * timepoint, data = df, col = c("skyblue", "lightgreen", "lightpink"), main = "Plant Growth by Treatment and Timepoint", xlab = "", ylab = "Plant Height", xaxt = "n") # Add rotated x-axis labels labels <- levels(interaction(df$treatment, df$timepoint)) axis(1, at = 1:length(labels), labels = FALSE) # Add ticks without labels... |
You cannot overwrite this file.
File usage
The following page uses this file: