File:Wgcna null dend.png
Original file (1,100 × 1,100 pixels, file size: 198 KB, MIME type: image/png)
Summary
<syntaxhighlight lang='r'> library(WGCNA)
- Set seed for reproducibility
set.seed(123)
- 1. Create a "Scaffold" for 3 modules (patterns of expression)
nSamples = 50
- 2. Generate 1000 genes based on these patterns + some noise
- Module 1: 200 genes correlated with pattern 1
noise = matrix(rnorm(nSamples*1000), nrow=nSamples)
- 3. Combine into one expression matrix (Samples as Rows, Genes as Columns)
datExpr2 = as.data.frame(noise) colnames(datExpr2) = paste0("Gene", 1:1000) rownames(datExpr2) = paste0("Sample", 1:50)
- Check dimensions (Should be 50 x 1000)
print(dim(datExpr2))
- Choose Soft Threshold
powers = c(c(1:10), seq(from = 12, to=30, by=2)) sft = pickSoftThreshold(datExpr2, powerVector = powers, verbose = 3)
- Plotting the results (Scale-Free Topology)
- you should see the $R^2$ curve rise quickly.
- The curve should hit a plateau (usually above 0.8 or 0.9) at a relatively low power (like 6 or 8).
- See "WGCNA: an R package for weighted gene co-expression network analysis,"
- Official WGCNA FAQ and Documentation https://edo98811.github.io/WGCNA_official_documentation/faq.html
- says for more than 40 samples, power=6 for Unsigned and signed hybrid networks
- power=12 for Signed networks
- Choose signed network, if I want to see separate modules for upregulated genes and downregulated genes.
- For signed network, modules are easier to interpret because all genes in a cluster move together.
- Strongly recommended in later documentation for better biological accuracy.
- Verdict:
- If you are studying a disease vs. control and want to know which genes are
- "activated" as a functional unit, choose Signed. If you just want to find
- any genes that are mathematically related regardless of direction, stay with Unsigned.
- Check the power suggested by the package
sft$powerEstimate # NA
- If sft$powerEstimate returns NA, it means the data never hit the internal default threshold (usually 0.90)
plot(sft$fitIndices[,1], -sign(sft$fitIndices[,3])*sft$fitIndices[,2],
    xlab="Soft Threshold (power)", ylab="Scale Free Topology Model Fit,signed R^2",
    type="n", main = "Scale Independence")
text(sft$fitIndices[,1], -sign(sft$fitIndices[,3])*sft$fitIndices[,2],
labels=powers, col="red")
- Even at power 10, your model fit is only at 0.25.
- In a successful WGCNA run, you want that value on the y-axis to be near 0.80.
- the "Scale-Free Topology" fit is finally behaving. It reached the magic threshold of 0.80 at power 30.
- Typically, for 50 samples, WGCNA authors suggest a power around 6 (for unsigned networks) or 12 (for signed networks).
- The fact that you need 30 suggests that the "Noise" we added in the simulation is very strong relative to the "Signals."
pow <- 12 net = blockwiseModules(datExpr2, power = pow, TOMType = "signed",
                      minModuleSize = 30, reassignThreshold = 0,
                      mergeCutHeight = 0.25, numericLabels = TRUE,
                      pamRespectsDendro = FALSE, verbose = 3)
- Calculating module eigengenes block-wise from all genes
- Flagging genes and samples with too many missing values...
- ..step 1
- ..Working on block 1 .
- TOM calculation: adjacency..
- ..will not use multithreading.
- Fraction of slow calculations: 0.000000
- ..connectivity..
- ..matrix multiplication (system BLAS)..
- ..normalization..
- ..done.
- ....clustering..
- ....detecting modules..
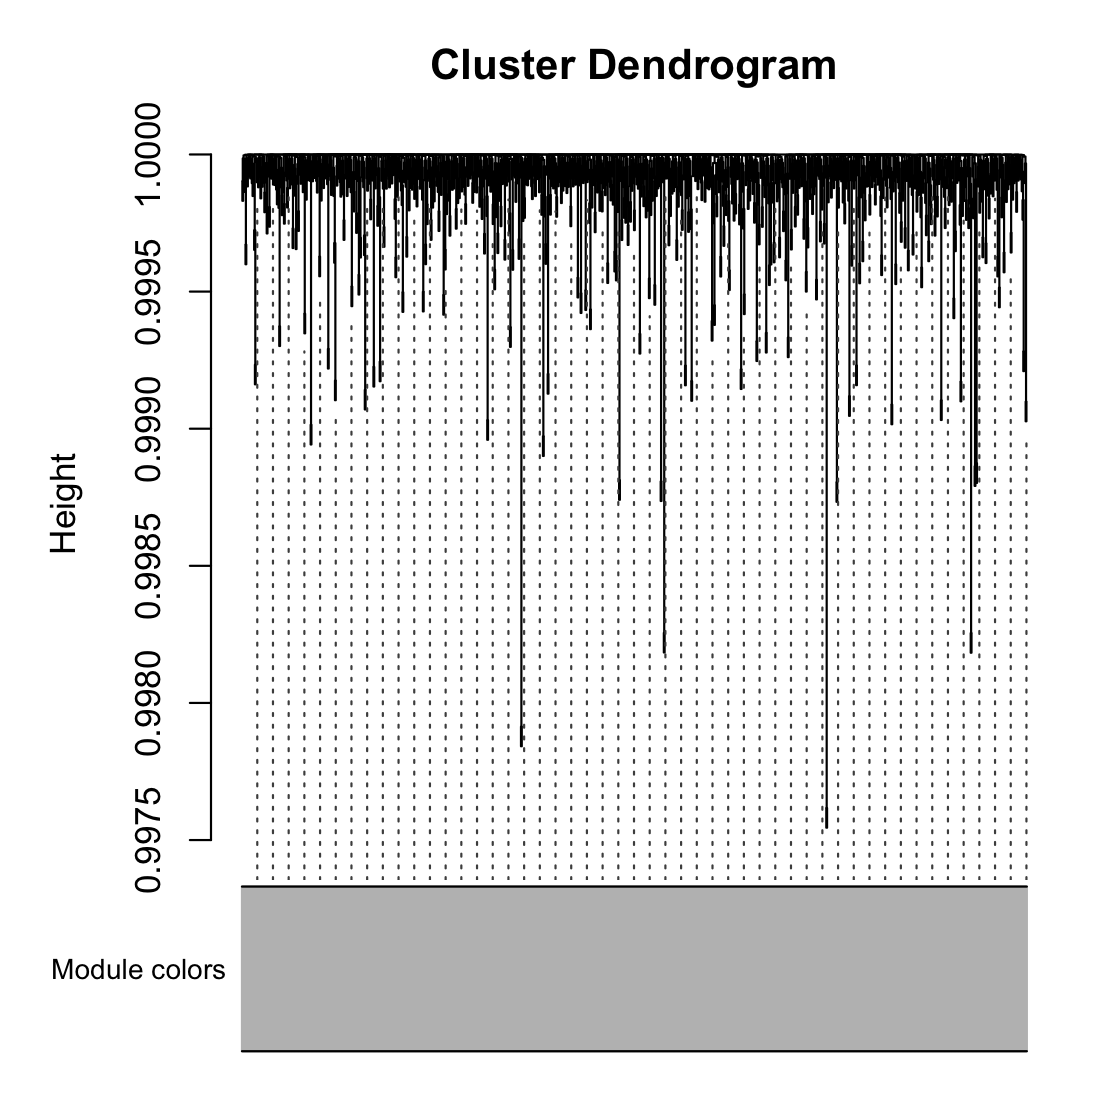
- No modules detected in block 1
- ..merging modules that are too close..
- mergeCloseModules: Merging modules whose distance is less than 0.25
- Warning message:
- In blockwiseModules(datExpr2, power = pow, TOMType = "signed", minModuleSize = 30, :
- blockwiseModules: mergeCloseModules failed with the following error message:
- Error in mergeCloseModules(datExpr, colors[gsg$goodGenes], cutHeight = mergeCutHeight, :
- Error in moduleEigengenes(expr = exprDataset$data, colors = setColors, :
- Color levels are empty. Possible reason: the only color is grey and grey module is excluded from the calculation.
- --> returning unmerged colors.
- Visualize the clusters
moduleColors = labels2colors(net$colors) plotDendroAndColors(net$dendrograms1, moduleColors[net$blockGenes1],
                   "Module colors", dendroLabels = FALSE, hang = 0.03,
                   addGuide = TRUE, guideHang = 0.05)
- 0 is always the unassigned/grey module.
table(net$colors)
- 0
- 1000
<syntaxhighlight>
File history
Click on a date/time to view the file as it appeared at that time.
| Date/Time | Thumbnail | Dimensions | User | Comment | |
|---|---|---|---|---|---|
| current | 09:19, 25 February 2026 | | 1,100 × 1,100 (198 KB) | Brb (talk | contribs) | <syntaxhighlight lang='r'> library(WGCNA) # Set seed for reproducibility set.seed(123) # 1. Create a "Scaffold" for 3 modules (patterns of expression) nSamples = 50 # 2. Generate 1000 genes based on these patterns + some noise # Module 1: 200 genes correlated with pattern 1 noise = matrix(rnorm(nSamples*1000), nrow=nSamples) # 3. Combine into one expression matrix (Samples as Rows, Genes as Columns) datExpr2 = as.data.frame(noise) colnames(datExpr2) = paste0("Gene", 1:1000) rownames(datEx... |
You cannot overwrite this file.
File usage
The following page uses this file: