Uploads by Brb
Jump to navigation
Jump to search
This special page shows all uploaded files.
| Date | Name | Thumbnail | Size | Description | Versions |
|---|---|---|---|---|---|
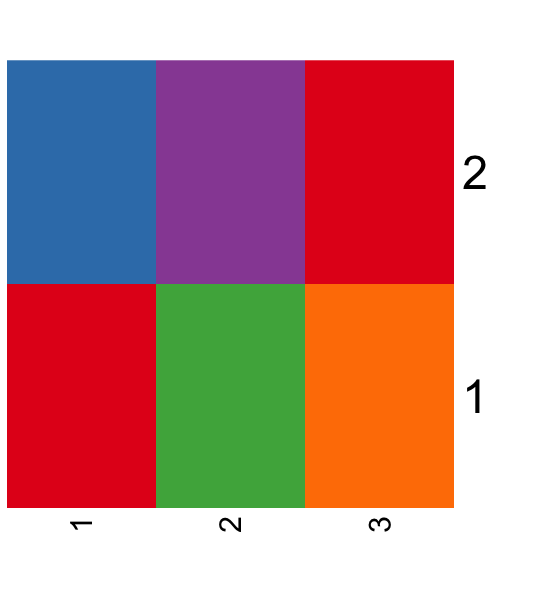
| 11:14, 10 May 2023 | Paletteheatmap.png (file) |  |
12 KB | <syntaxhighlight lang='rsplus'> pal <- c("#E41A1C", "#377EB8", "#4DAF4A", "#984EA3", "#FF7F00") pal <- matrix(pal, nr=2) # acknowledge a nice warning message pal_matrix <- matrix(seq_along(pal), nr=nrow(pal), nc=ncol(pal)) heatmap(pal_matrix, col = pal, Rowv = NA, Colv = NA, scale = "none", ylab = "", xlab = "", main = "", margins = c(5, 5)) # 2 rows, 3 columns with labeling on two axes </syntaxhighlight> | 1 |
| 14:00, 4 May 2016 | Toy merged.png (file) |  |
13 KB | 1 | |
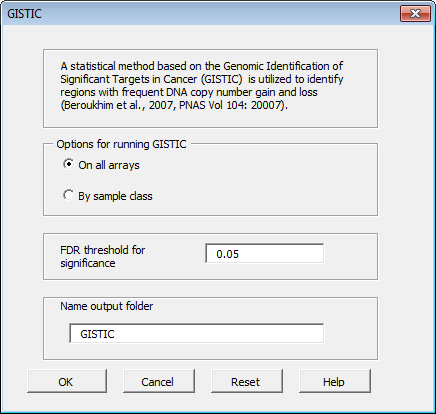
| 11:31, 10 April 2014 | CGHTools Gistic.png (file) |  |
14 KB | 1 | |
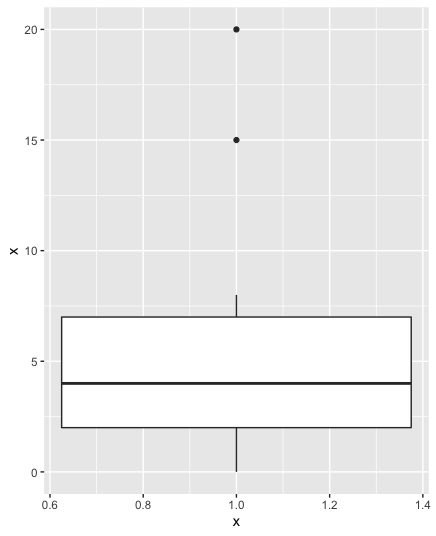
| 16:02, 25 November 2019 | Geom boxplot.png (file) |  |
14 KB | ggplot(data.frame(x), aes(1, x)) + geom_boxplot() | 1 |
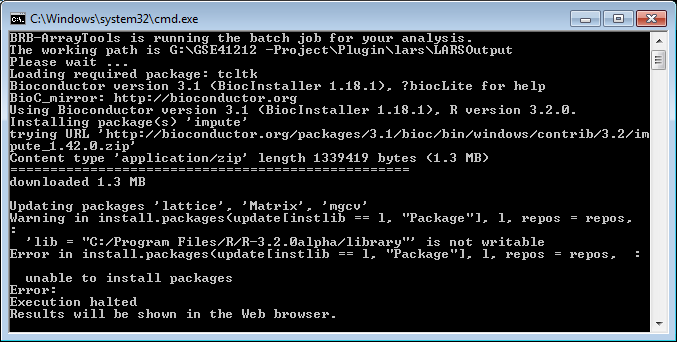
| 22:19, 8 October 2016 | Installpackage2.png (file) |  |
15 KB | 1 | |
| 14:46, 26 November 2015 | TreemapPop.png (file) |  |
15 KB | 1 | |
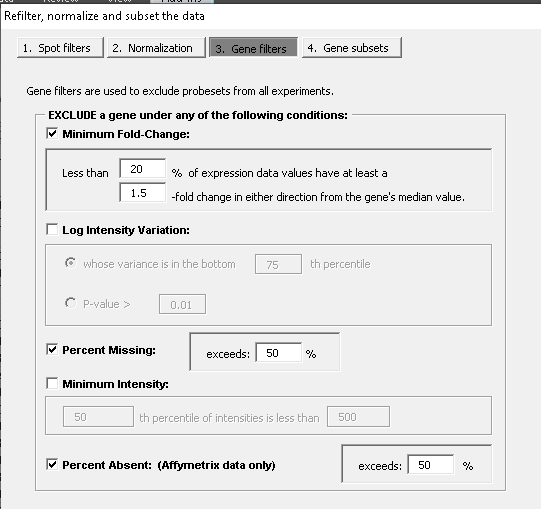
| 15:39, 31 July 2023 | Filter single.png (file) |  |
15 KB | 1 | |
| 09:51, 27 May 2022 | Inter base.png (file) |  |
15 KB | 1 | |
| 13:46, 21 May 2023 | R2.png (file) |  |
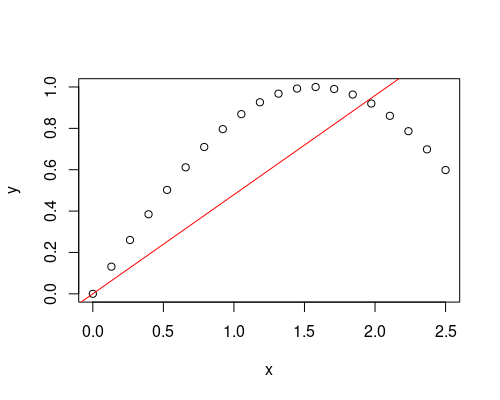
15 KB | <syntaxhighlight lang='rsplus'> x <- seq(0, 2.5, length=20) y <- sin(x) plot(x, y) abline(lsfit(x, y, intercept = F), col = 'red') summary(fit)$r.squared # [1] 0.8554949 </syntaxhighlight> | 1 |
| 07:08, 27 August 2022 | FgseaPlotTop.png (file) | 15 KB | 1 | ||
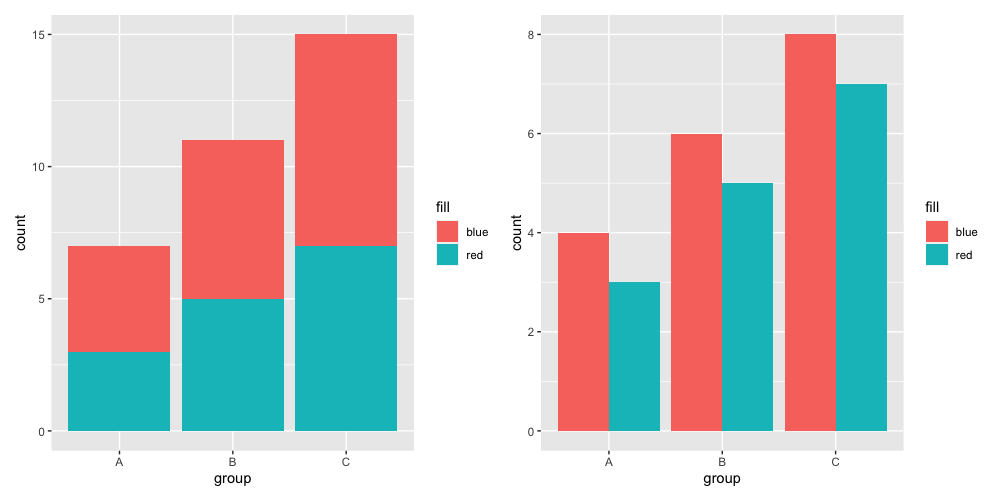
| 11:06, 6 October 2022 | Barplot ggplot2.png (file) |  |
16 KB | 1 | |
| 15:37, 5 September 2016 | Qlistview.png (file) |  |
17 KB | 1 | |
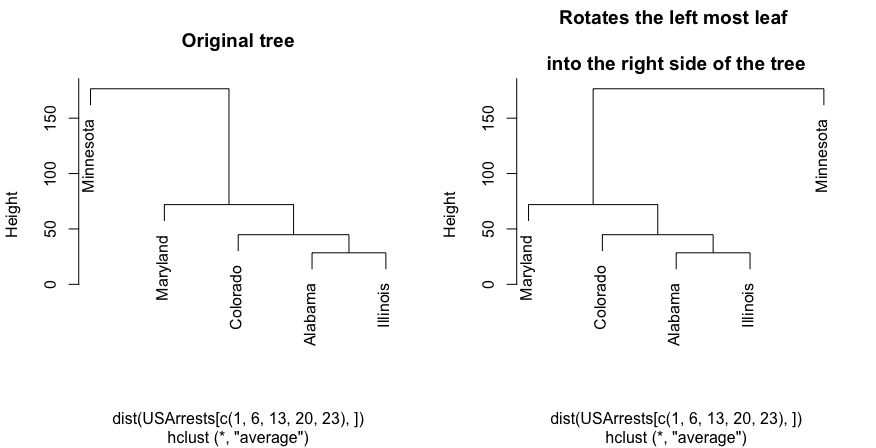
| 16:21, 12 August 2023 | Rotatedend.png (file) |  |
17 KB | 1 | |
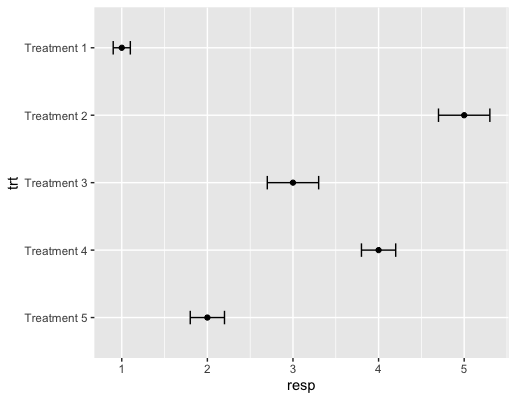
| 20:38, 15 October 2023 | Geomerrorbarh.png (file) |  |
17 KB | <syntaxhighlight lang='rsplus'> df <- data.frame( trt = factor(c("Treatment 1", "Treatment 2", "Treatment 3", "Treatment 4", "Treatment 5")), # treatment resp = c(1, 5, 3, 4, 2), # response se = c(0.1, 0.3, 0.3, 0.2, 0.2) # standard error ) # make 'Treatment 1' shown at the top df$trt <- factor(df$trt, levels = c("Treatment 5", "Treatment 4", "Treatment 3", "Treatment 2", "Treatment 1")) p <- ggplot(df, aes(resp, trt)) + geom_point() p + geom_errorbarh(aes(xmax=resp + se, xmin=resp-se),... | 1 |
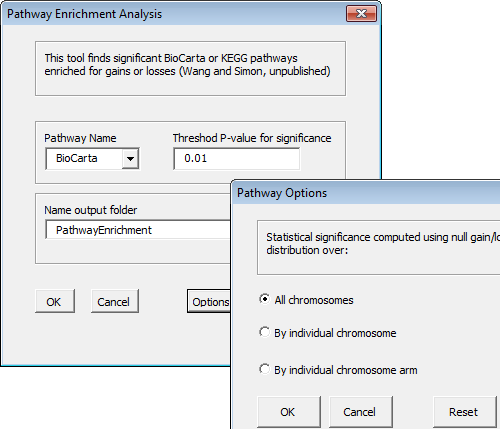
| 11:31, 10 April 2014 | CGHTools Pathway.png (file) |  |
17 KB | 1 | |
| 13:16, 21 September 2015 | Vbox5.png (file) |  |
17 KB | 1 | |
| 10:48, 20 October 2022 | 1NN better NC.png (file) |  |
18 KB | 1 | |
| 16:50, 13 November 2014 | Simpleimage.png (file) |  |
18 KB | 1 | |
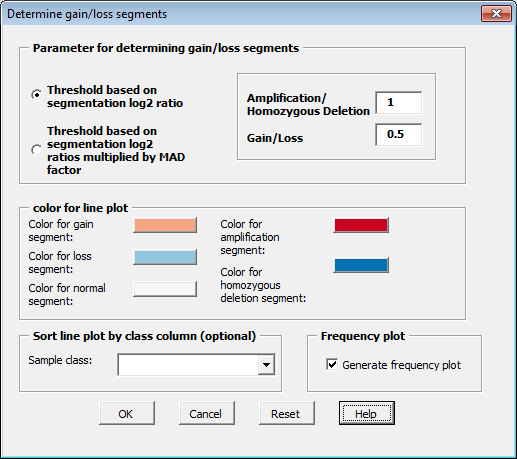
| 11:30, 10 April 2014 | CGHTools GainLoss.png (file) |  |
18 KB | 1 | |
| 17:08, 13 November 2014 | Simpleimage2.png (file) |  |
18 KB | 1 | |
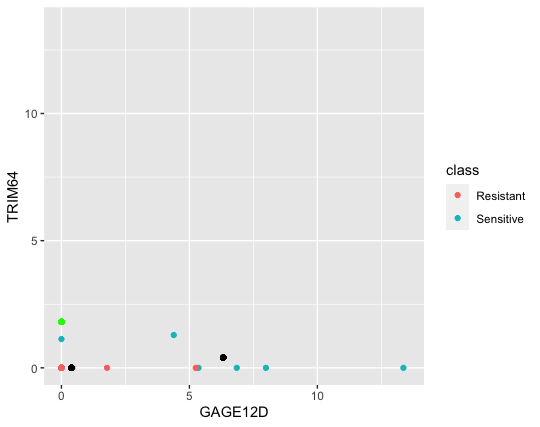
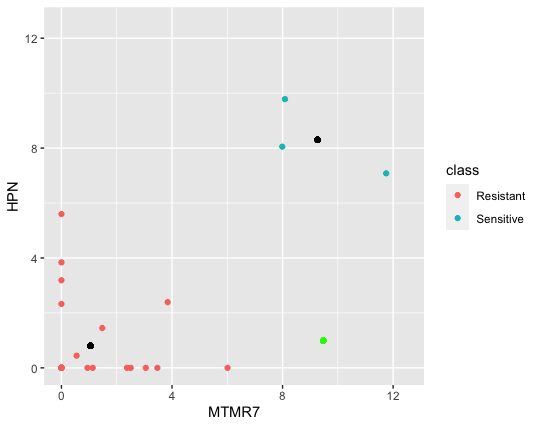
| 17:26, 19 October 2022 | NC better kNN.png (file) |  |
19 KB | The green color is a new observation (Sensitive). By using the kNN method, it will be assigned to Resistant b/c it is closer to the Resistant group. However, using the NC, the distance of it to the Resistant group centroid is 8.42 which is larger than the distance of it to the Sensitive groups centroid 7.31. So NC classified it to Sensitive. Color annotation: green=LOO obs, black=centroid in each class. | 1 |
| 16:11, 3 November 2016 | Mate softwareUpdate done.png (file) |  |
19 KB | 1 | |
| 10:50, 24 January 2021 | Scalefill.png (file) |  |
19 KB | 1 | |
| 11:06, 30 November 2017 | Webex audio.png (file) | 19 KB | 1 | ||
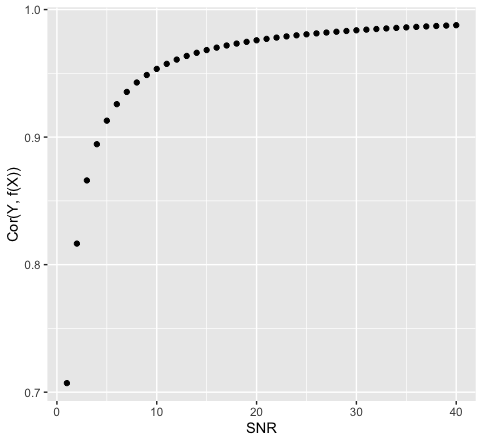
| 14:13, 18 March 2022 | SnrVScor.png (file) |  |
20 KB | 1 | |
| 18:46, 24 July 2015 | QtOpenSourceMinGW.png (file) |  |
20 KB | 1 | |
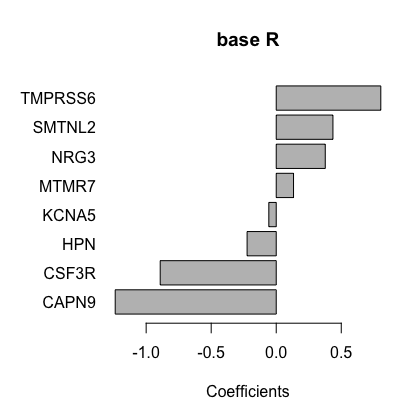
| 11:11, 6 October 2022 | Barplot base.png (file) |  |
20 KB | 2 | |
| 16:27, 27 December 2017 | Beaglebone48.png (file) |  |
20 KB | 1 | |
| 15:15, 27 October 2022 | DHdialog1.png (file) |  |
21 KB | 1 | |
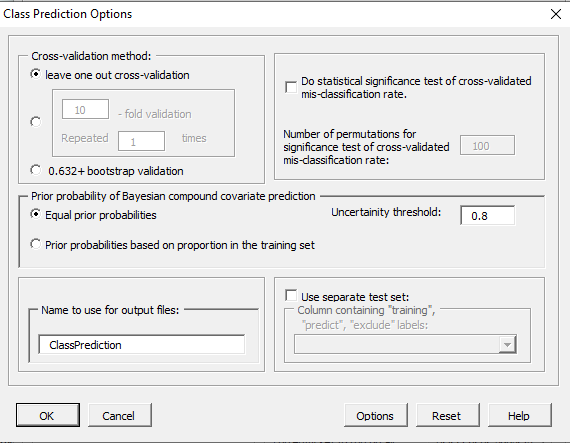
| 11:10, 11 February 2023 | ClassPredictionOptions.PNG (file) |  |
21 KB | 1 | |
| 09:51, 27 May 2022 | Inter gg.png (file) |  |
21 KB | 1 | |
| 10:11, 19 June 2016 | Qt setup.png (file) |  |
21 KB | 1 | |
| 22:26, 28 December 2013 | Ftdi2ttlRaspPi.png (file) |  |
21 KB | 1 | |
| 14:54, 27 April 2015 | RPackageWriting.png (file) |  |
21 KB | 1 | |
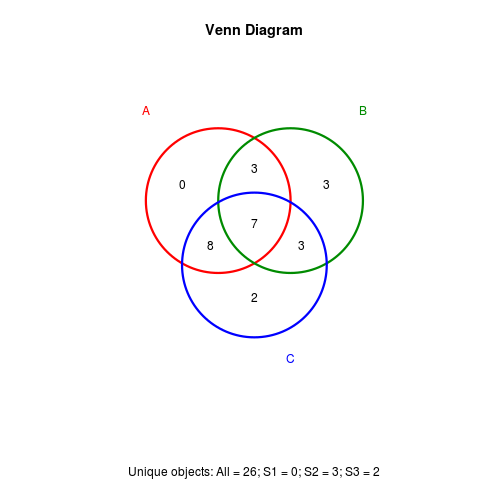
| 15:50, 21 August 2016 | Vennplot.png (file) |  |
22 KB | 1 | |
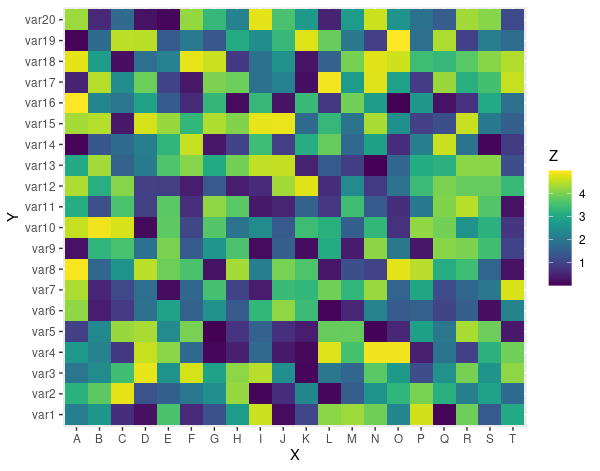
| 10:08, 30 August 2022 | ScaleFillViridisDiscrete.png (file) |  |
22 KB | See https://r-graph-gallery.com/79-levelplot-with-ggplot2.html <pre> library(ggplot2) # library(hrbrthemes) # Dummy data x <- LETTERS[1:20] y <- paste0("var", seq(1,20)) data <- expand.grid(X=x, Y=y) data$Z <- runif(400, 0, 5) library(viridis) ggplot(data, aes(X, Y, fill= Z)) + geom_tile() + scale_fill_viridis(discrete=FALSE) </pre> | 1 |
| 12:53, 1 December 2016 | At sample naming.png (file) |  |
22 KB | 1 | |
| 08:36, 20 June 2017 | Iterm open.png (file) |  |
22 KB | 1 | |
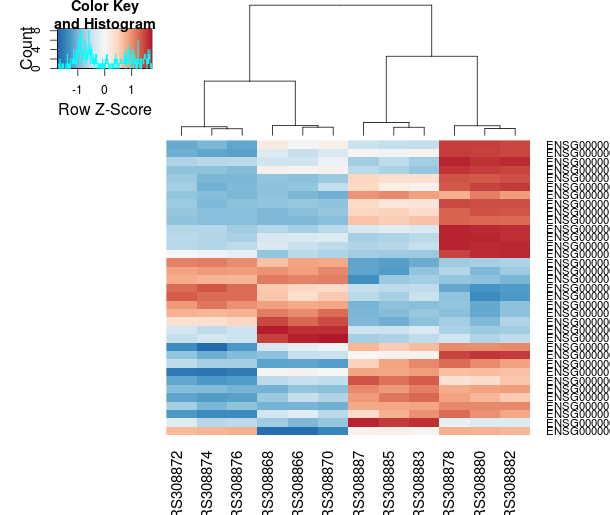
| 10:13, 1 October 2014 | Heatmap deseq2.png (file) |  |
22 KB | 1 | |
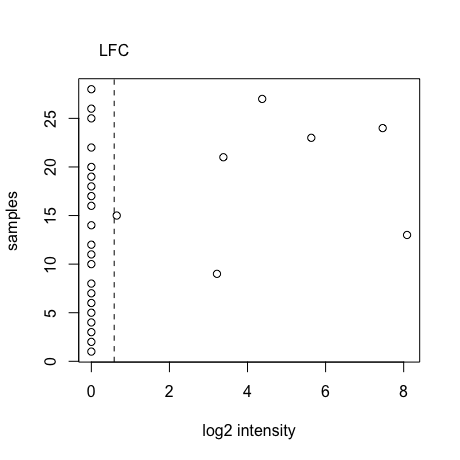
| 11:03, 12 October 2022 | Foldchangefilter.png (file) |  |
22 KB | <pre> LFC <- log2(1.5) x <- c(0, 0, 0, 0, 0, 0, 0, 0, 3.22, 0, 0, 0, 8.09, 0, 0.65, 0, 0, 0, 0, 0, 3.38, 0, 5.63, 7.46, 0, 0, 4.38, 0) plot(x, y = 1:28, xlab="log2 intensity", ylab="samples") abline(v=LFC, lty="dashed") axis(side=3,at=LFC, labels="LFC", tick=FALSE, line=0) </pre> | 1 |
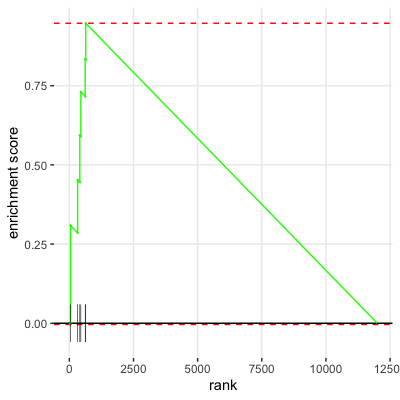
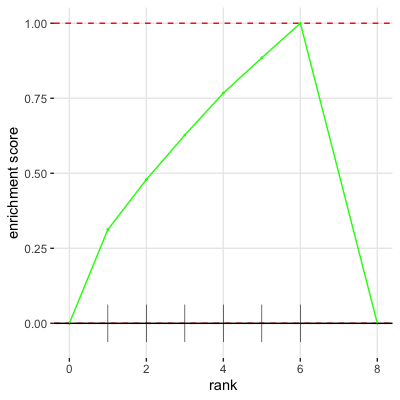
| 06:33, 27 August 2022 | FgseaPlot.png (file) |  |
23 KB | 1 | |
| 09:34, 6 June 2018 | Aml time.svg (file) |  |
23 KB | 1 | |
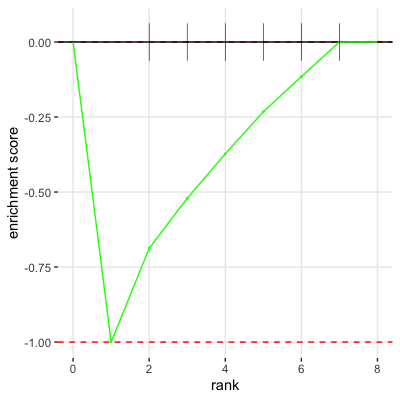
| 06:34, 27 August 2022 | FgseaPlotSmall2.png (file) |  |
23 KB | 1 | |
| 13:52, 9 May 2023 | Ggplotbarplot.png (file) |  |
23 KB | 1 | |
| 12:51, 13 December 2017 | KMcurve cumhaz.png (file) |  |
24 KB | 1 | |
| 06:34, 27 August 2022 | FgseaPlotSmall.png (file) |  |
24 KB | 1 | |
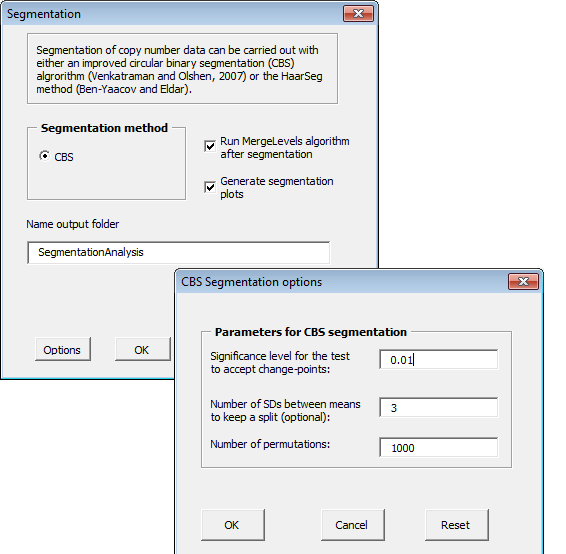
| 11:30, 10 April 2014 | CGHTools Segmentation.png (file) |  |
24 KB | 1 | |
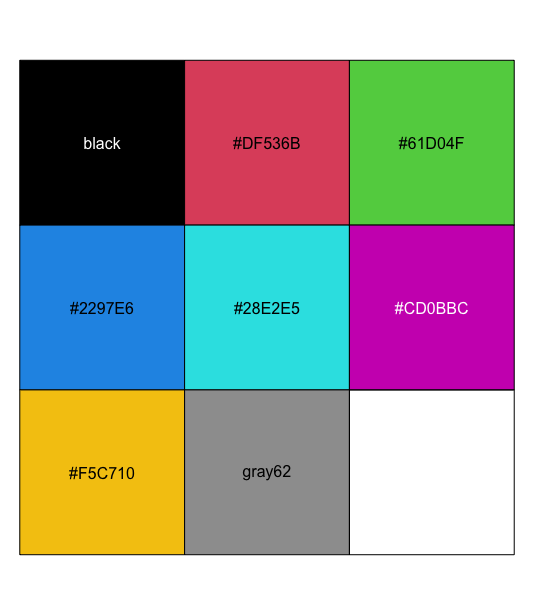
| 12:12, 10 May 2023 | Paletteshowcol.png (file) |  |
24 KB | 1 | |
| 10:36, 1 July 2015 | D3heatmap zoomin.png (file) |  |
24 KB | 1 | |
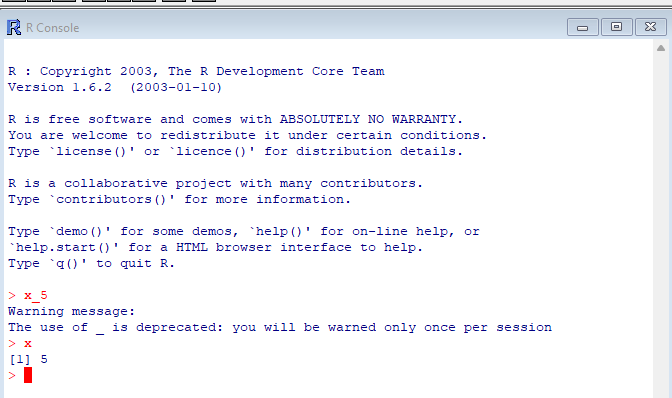
| 22:41, 10 February 2024 | R162.png (file) |  |
25 KB | 1 |