Uploads by Brb
Jump to navigation
Jump to search
This special page shows all uploaded files.
| Date | Name | Thumbnail | Size | Description | Versions |
|---|---|---|---|---|---|
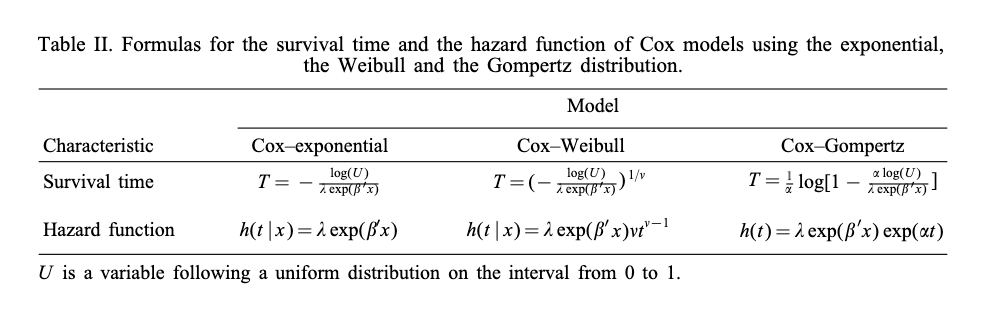
| 09:16, 3 June 2020 | Bender2005table2.png (file) |  |
76 KB | 1 | |
| 09:20, 9 August 2013 | Bio7 1.png (file) |  |
56 KB | 1 | |
| 09:21, 9 August 2013 | Bio7 2.png (file) |  |
31 KB | 1 | |
| 09:21, 9 August 2013 | Bio7 3.png (file) |  |
61 KB | 1 | |
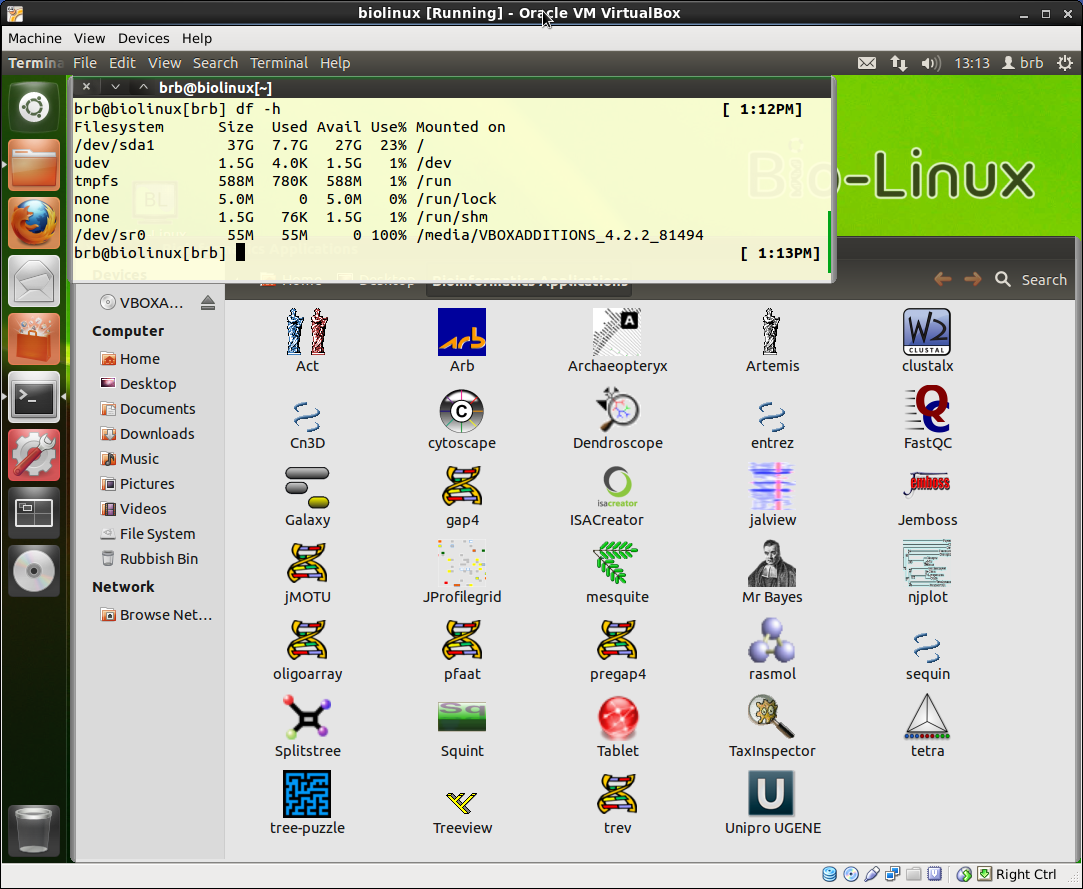
| 14:15, 23 November 2012 | BioLinux.png (file) |  |
335 KB | 1 | |
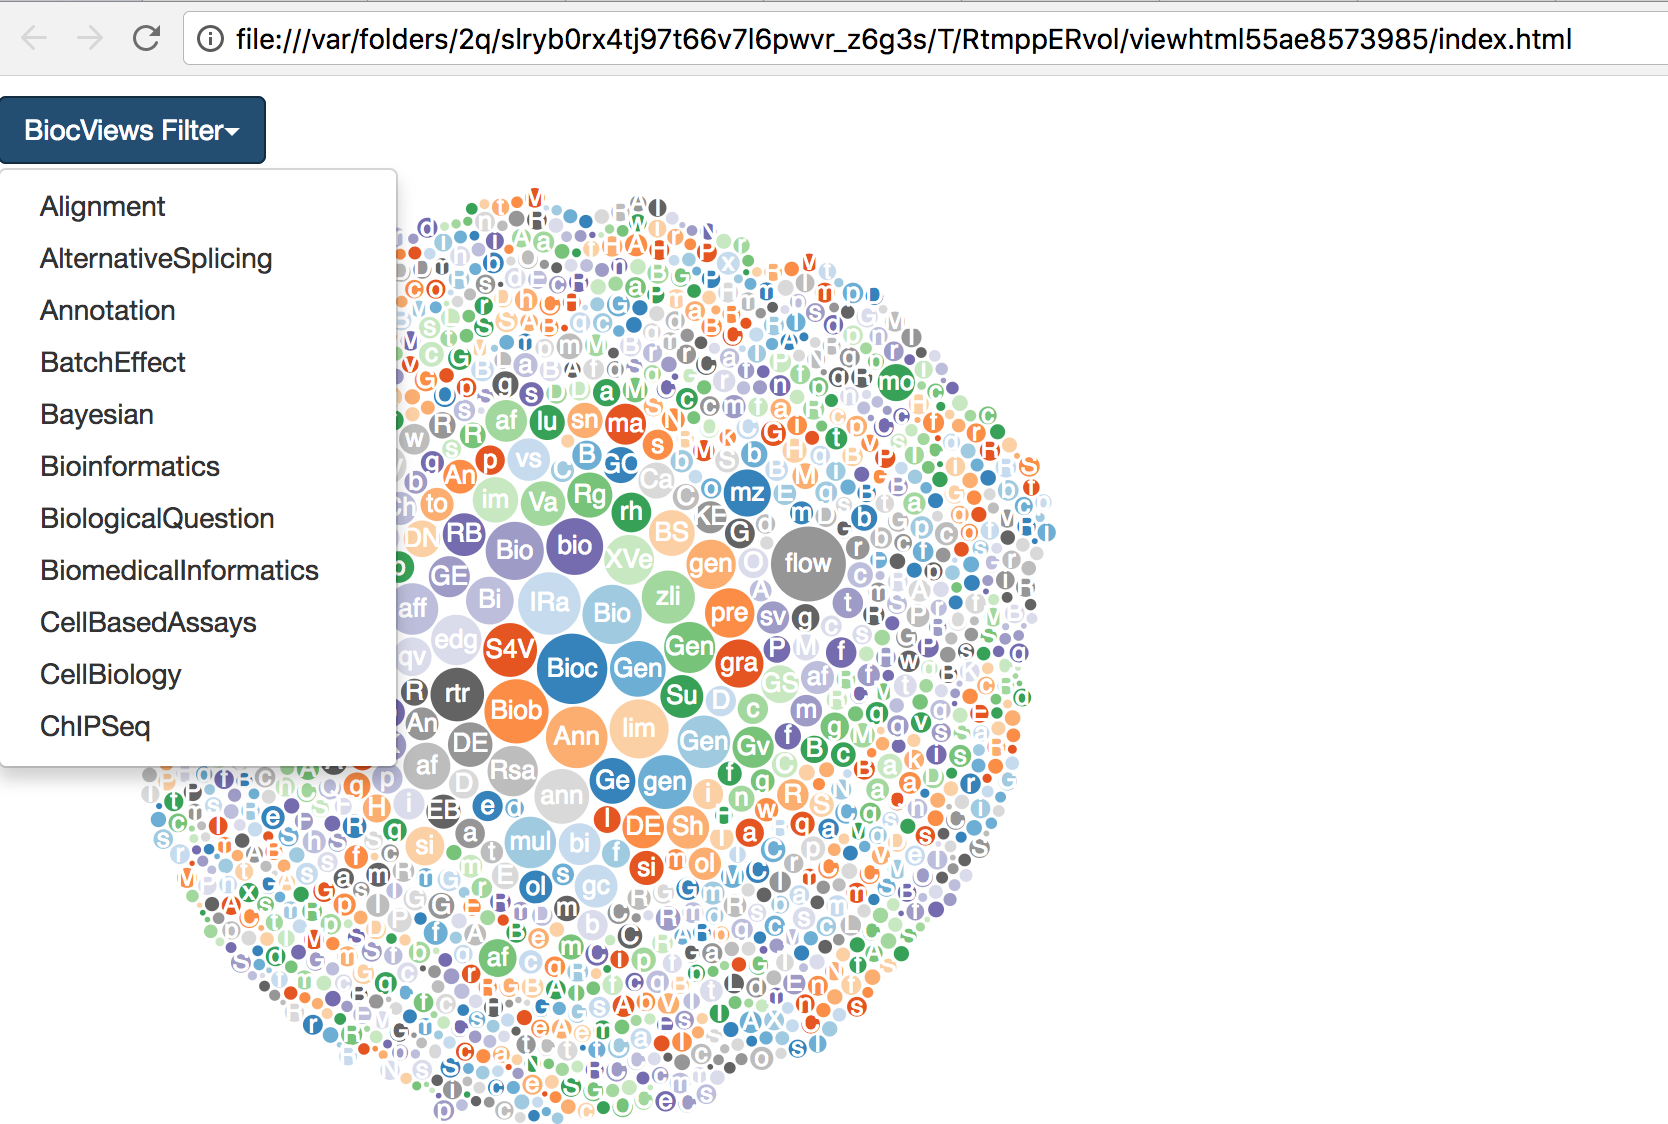
| 16:32, 5 January 2018 | BiocExplorer.png (file) |  |
781 KB | 1 | |
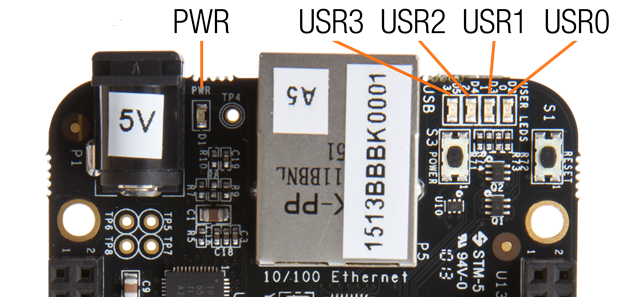
| 21:22, 27 November 2013 | BlackUSR.png (file) |  |
286 KB | 1 | |
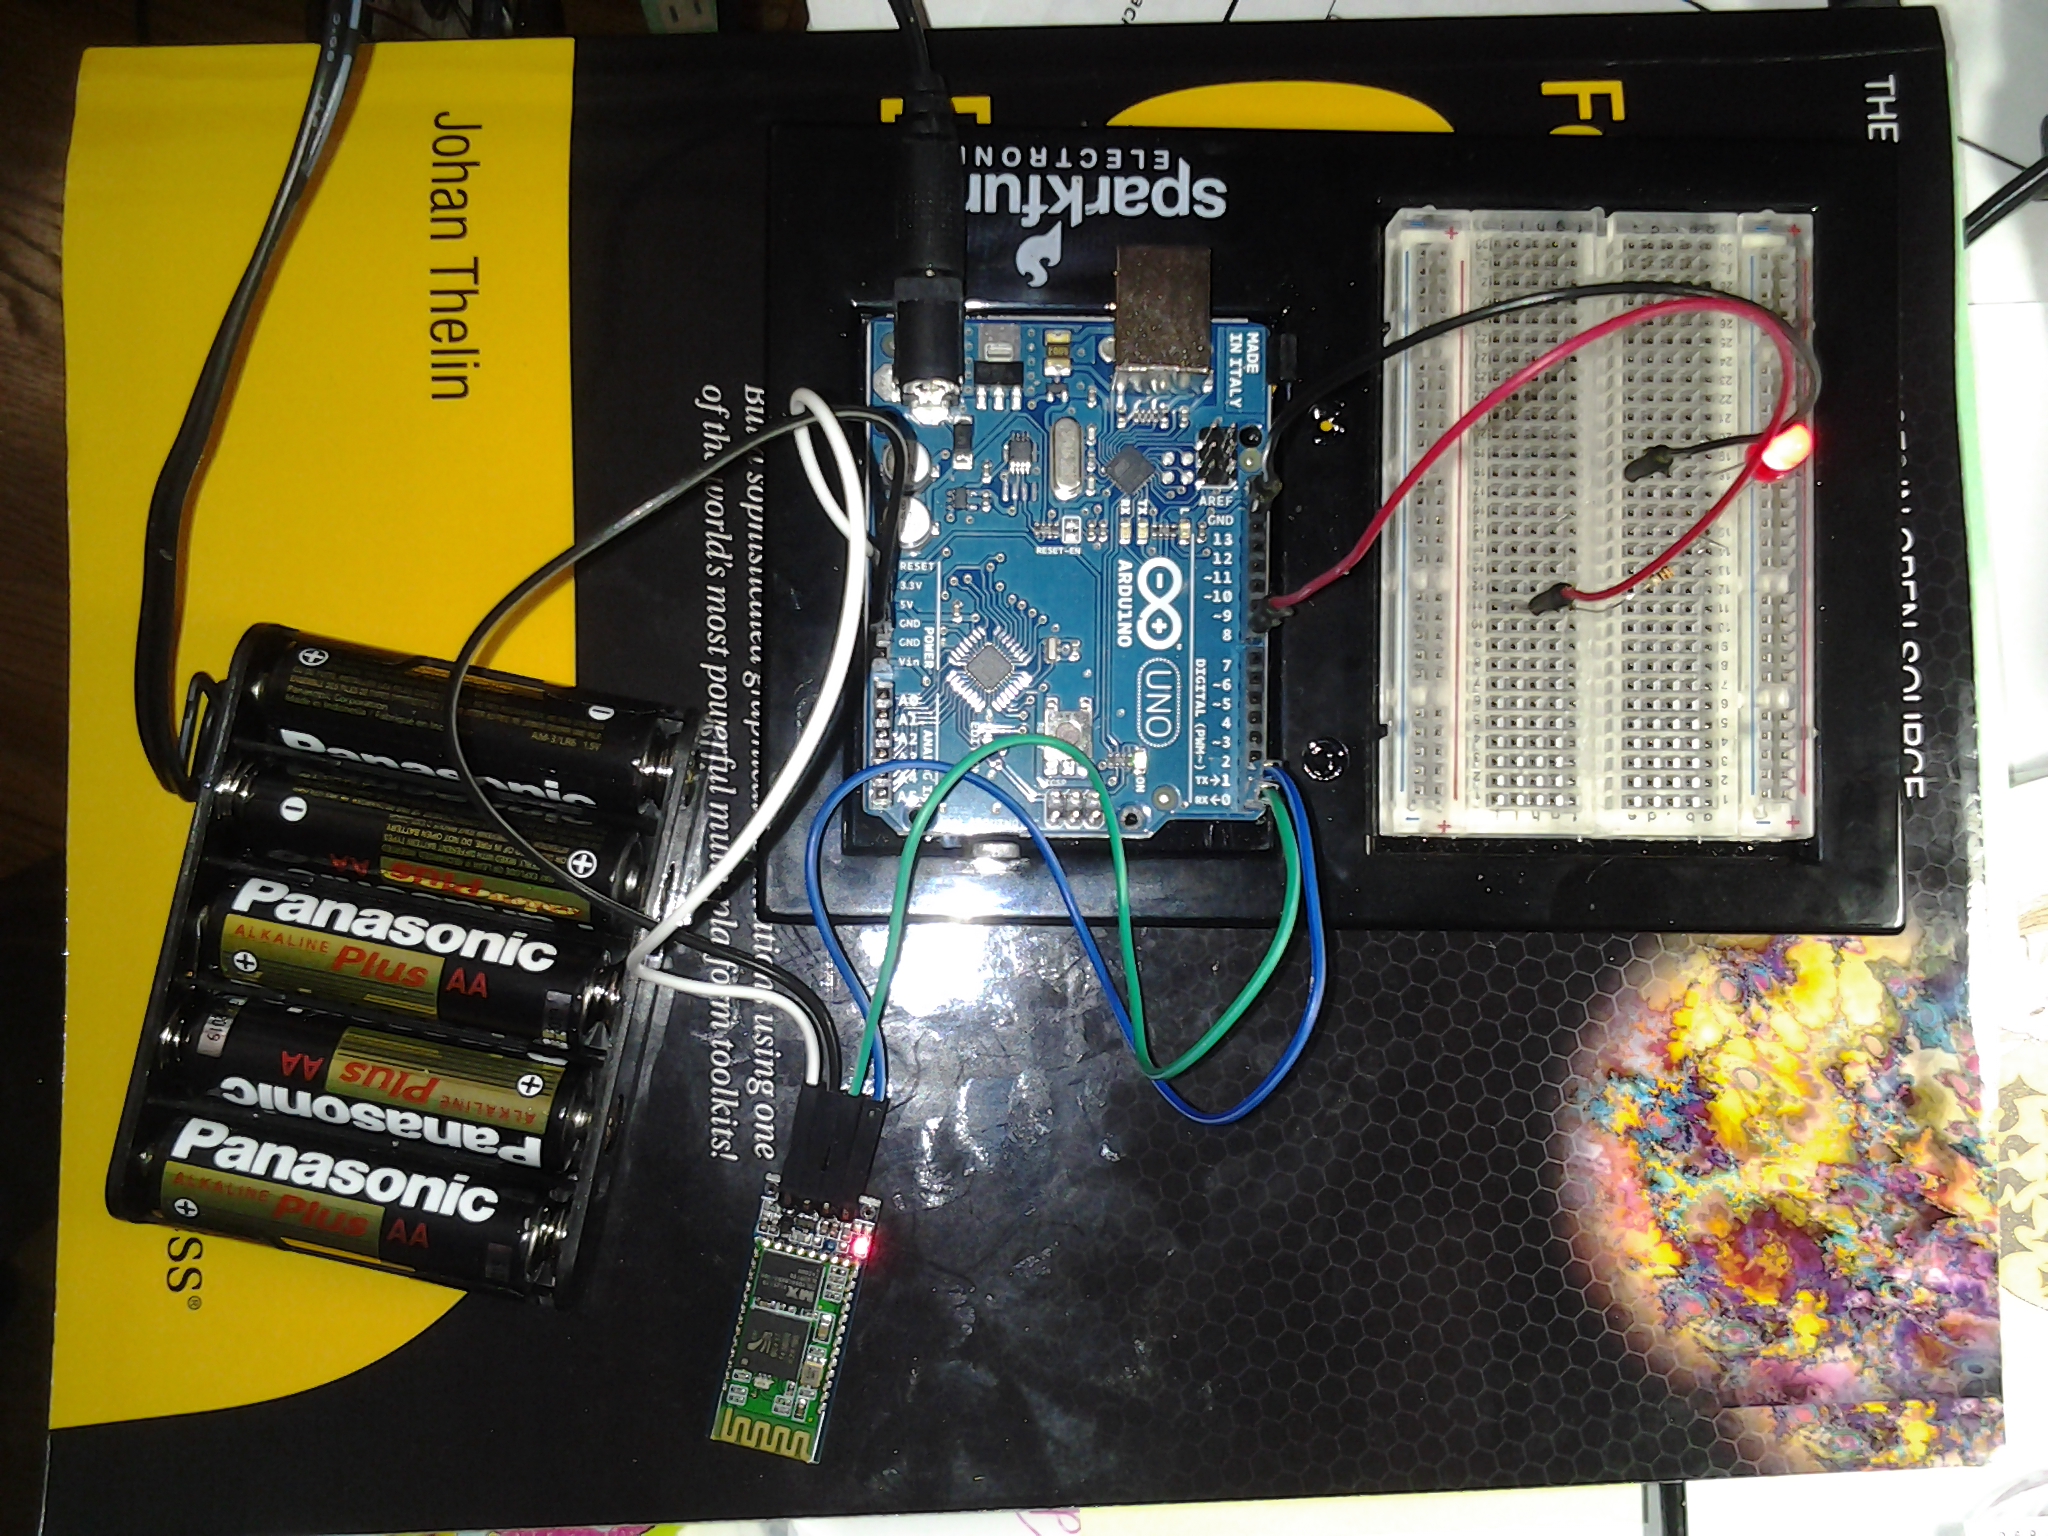
| 08:49, 13 June 2013 | Bluetooth.jpg (file) |  |
2.13 MB | JYMCU Bluetooth module http://dx.com/p/jy-mcu-arduino-bluetooth-wireless-serial-port-module-104299 | 1 |
| 15:34, 12 May 2016 | BluetoothAudioLinux.png (file) |  |
47 KB | 1 | |
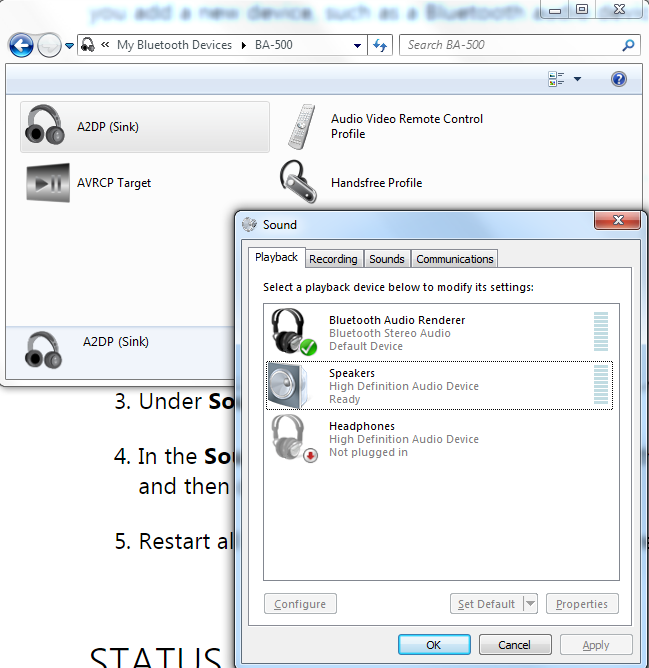
| 14:10, 18 February 2016 | BluetoothWindows.png (file) |  |
101 KB | 1 | |
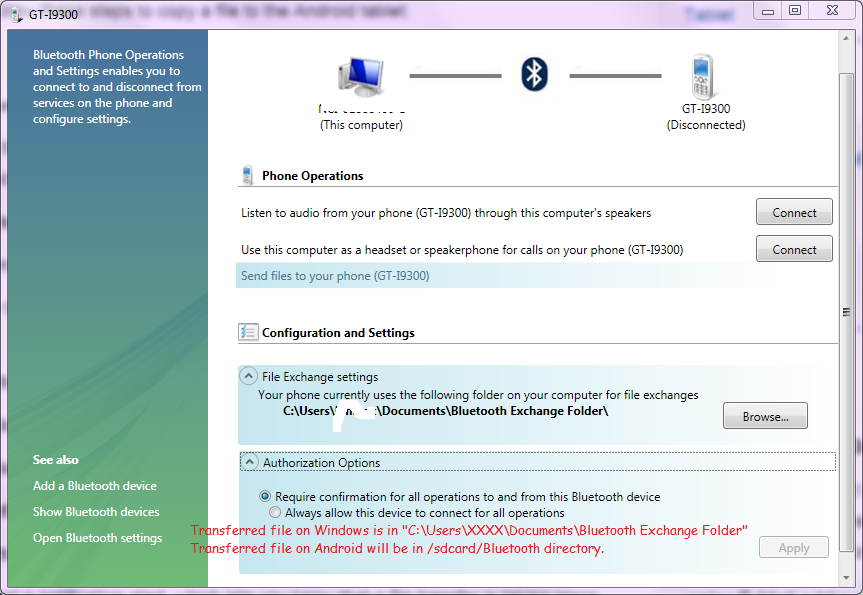
| 09:35, 20 October 2014 | Bluetooth Android Windows.png (file) |  |
182 KB | 1 | |
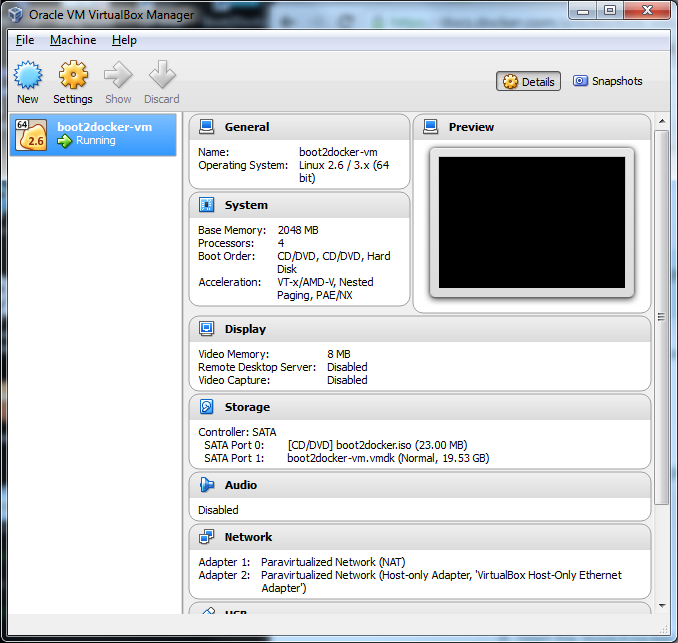
| 17:19, 27 January 2015 | Boot2docker-vm.png (file) |  |
104 KB | 1 | |
| 16:37, 21 September 2018 | Boxdot.svg (file) |  |
97 KB | boxplot(weight ~ feed, data = chickwts) par(new = TRUE) stripchart(weight ~ feed, data = chickwts, xlim=c(0.5,6.5), vertical=TRUE, method="stack", offset=0.8, pch=19, main = "Chicken weights after six weeks", xlab = "Feed Type", ylab = "Weight (g)") | 2 |
| 14:52, 28 April 2015 | Boxplot.svg (file) |  |
9 KB | 1 | |
| 11:15, 22 February 2013 | Build R log.txt (file) | 544 KB | Complete log of building R from source | 1 | |
| 19:22, 20 July 2018 | Byobu.png (file) |  |
88 KB | 1 | |
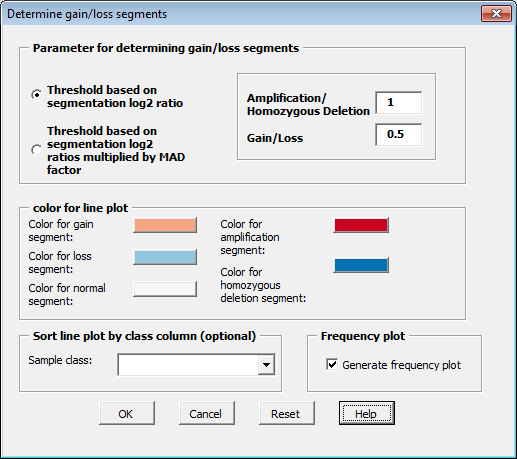
| 11:30, 10 April 2014 | CGHTools GainLoss.png (file) |  |
18 KB | 1 | |
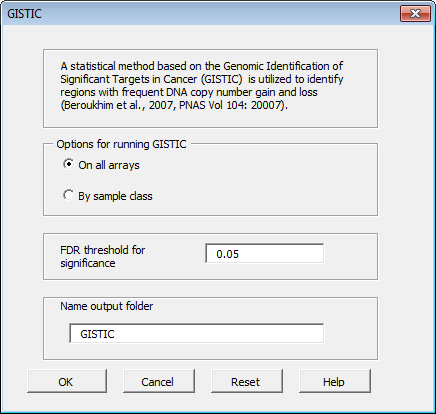
| 11:31, 10 April 2014 | CGHTools Gistic.png (file) |  |
14 KB | 1 | |
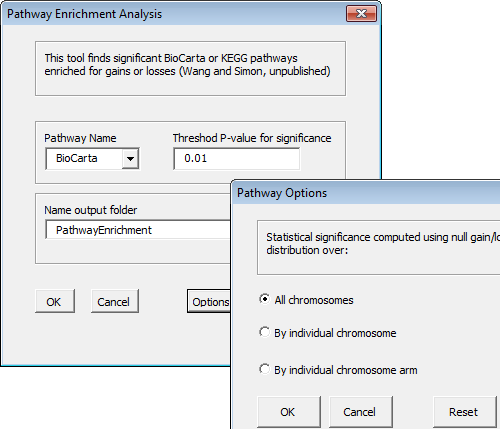
| 11:31, 10 April 2014 | CGHTools Pathway.png (file) |  |
17 KB | 1 | |
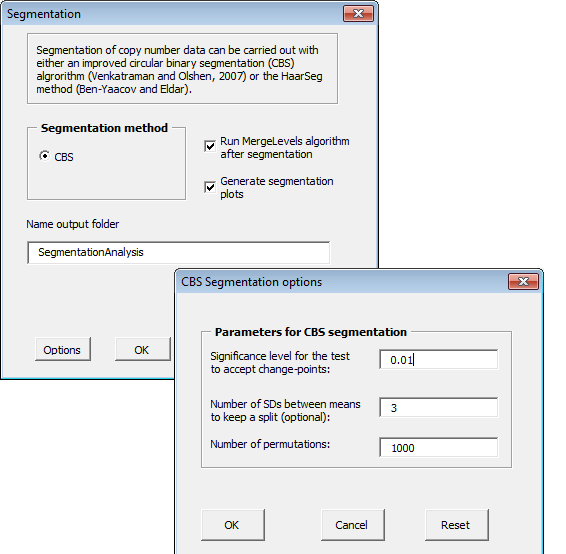
| 11:30, 10 April 2014 | CGHTools Segmentation.png (file) |  |
24 KB | 1 | |
| 14:51, 17 April 2018 | C stat scatter.svg (file) |  |
60 KB | 1 | |
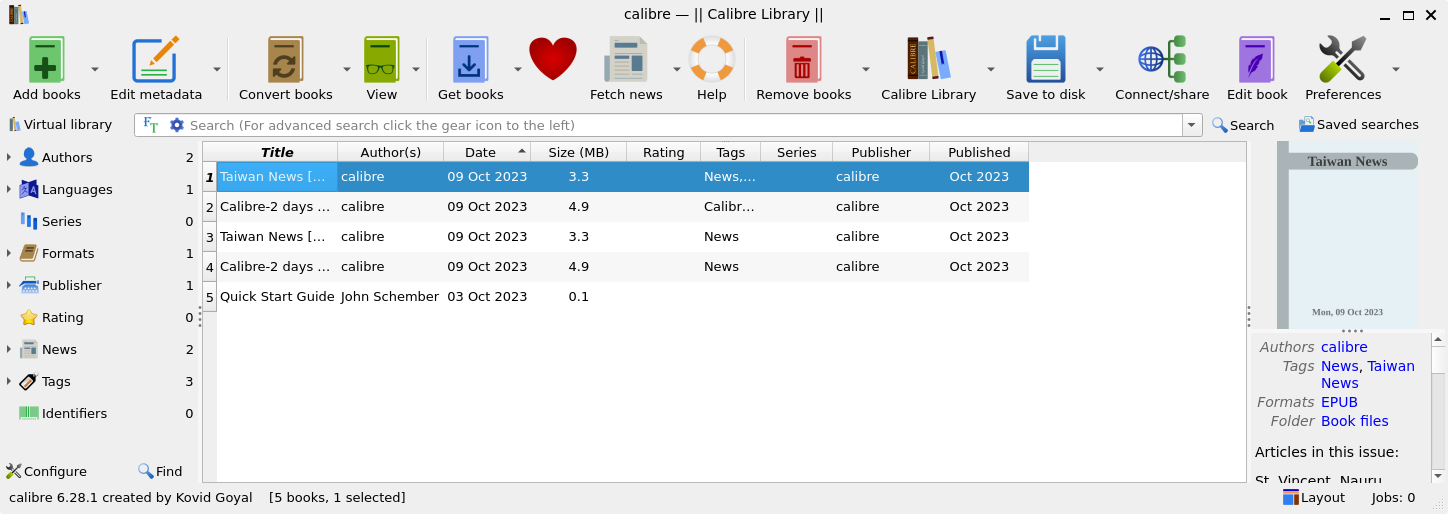
| 17:32, 9 October 2023 | Calibre.png (file) |  |
128 KB | 1 | |
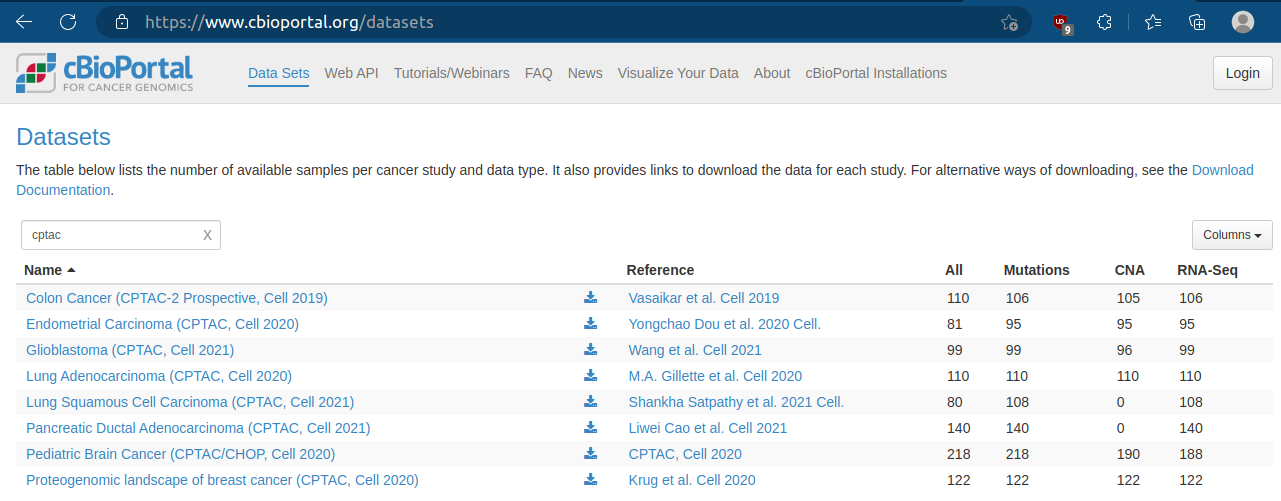
| 11:40, 9 May 2023 | Cbioportal cptac.png (file) |  |
120 KB | 1 | |
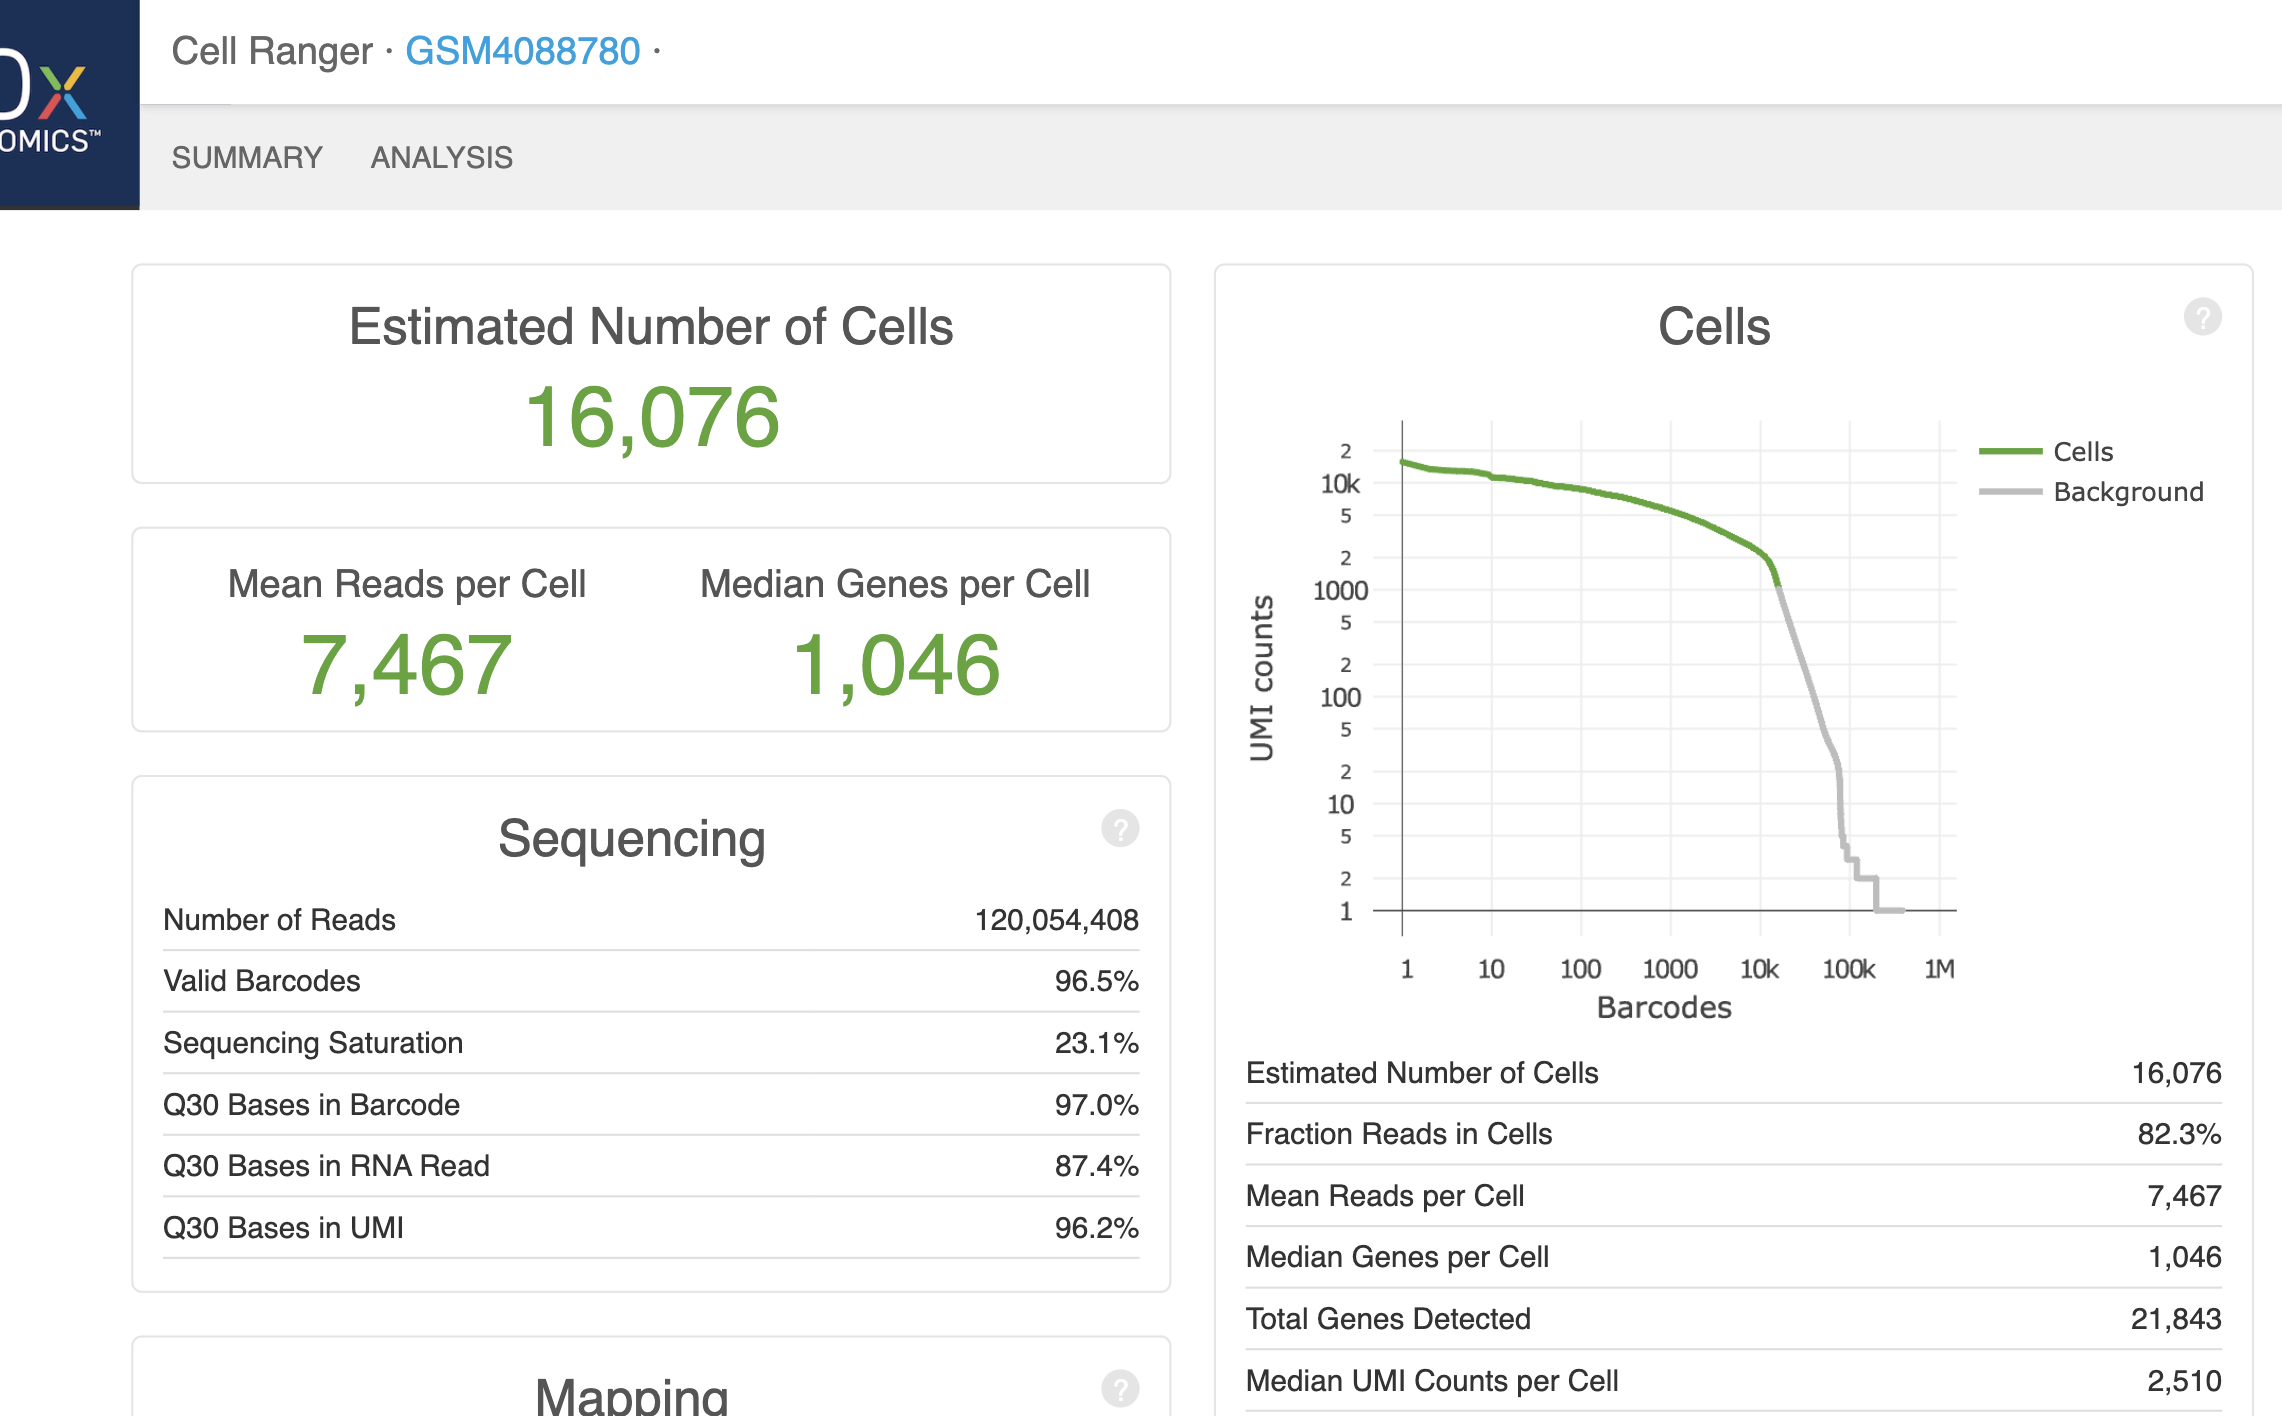
| 17:01, 30 April 2021 | Cellrangersum.png (file) |  |
430 KB | 1 | |
| 11:19, 24 July 2018 | CentosConOnline.png (file) |  |
33 KB | 1 | |
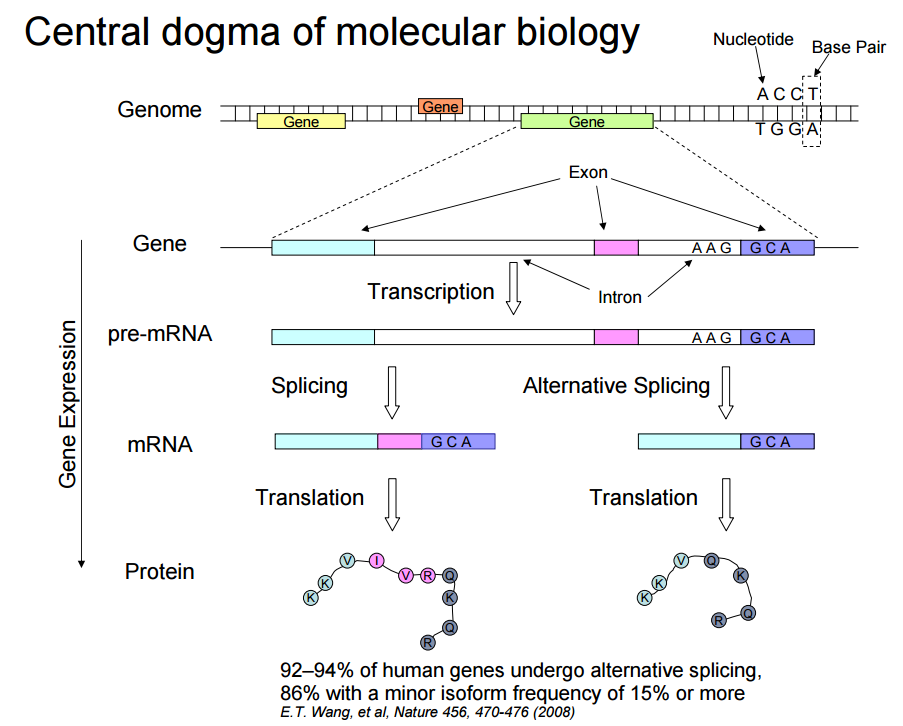
| 10:44, 24 July 2015 | CentralDogmaMolecular.png (file) |  |
90 KB | Downloaded from http://static.msi.umn.edu/tutorial/lifescience/RNA-Seq-Module-1.pdf | 1 |
| 13:33, 26 August 2019 | Check dist.svg (file) |  |
32 KB | 1 | |
| 21:12, 10 July 2015 | ChengSquattingsinglewhip.JPG (file) |  |
26 KB | 1 | |
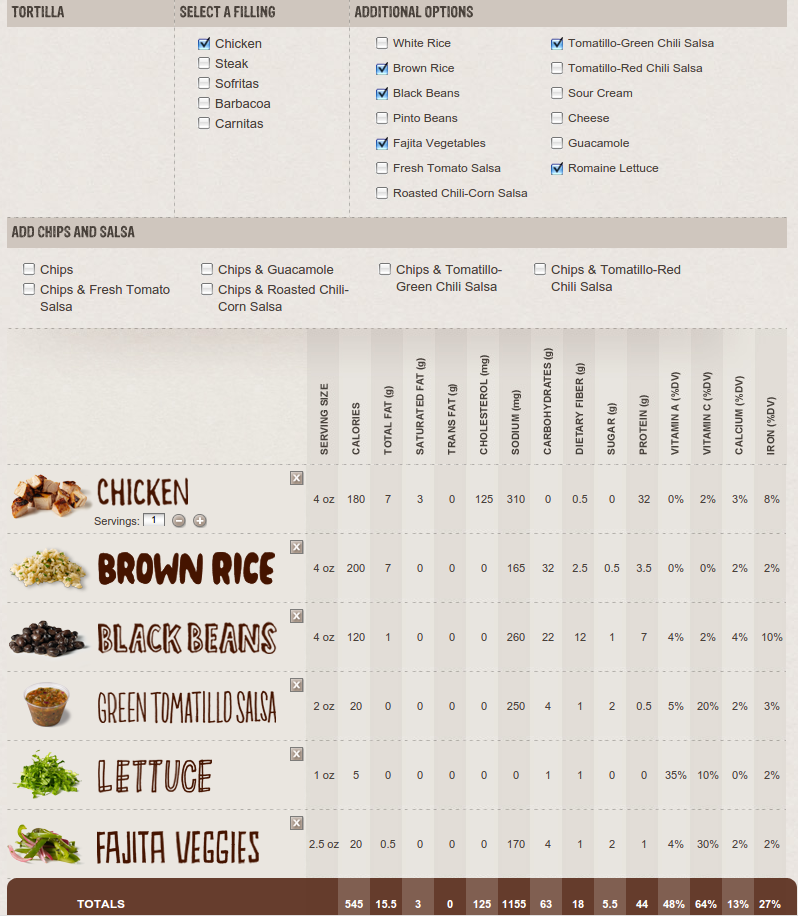
| 21:38, 5 October 2014 | Chipotle.png (file) |  |
351 KB | 1 | |
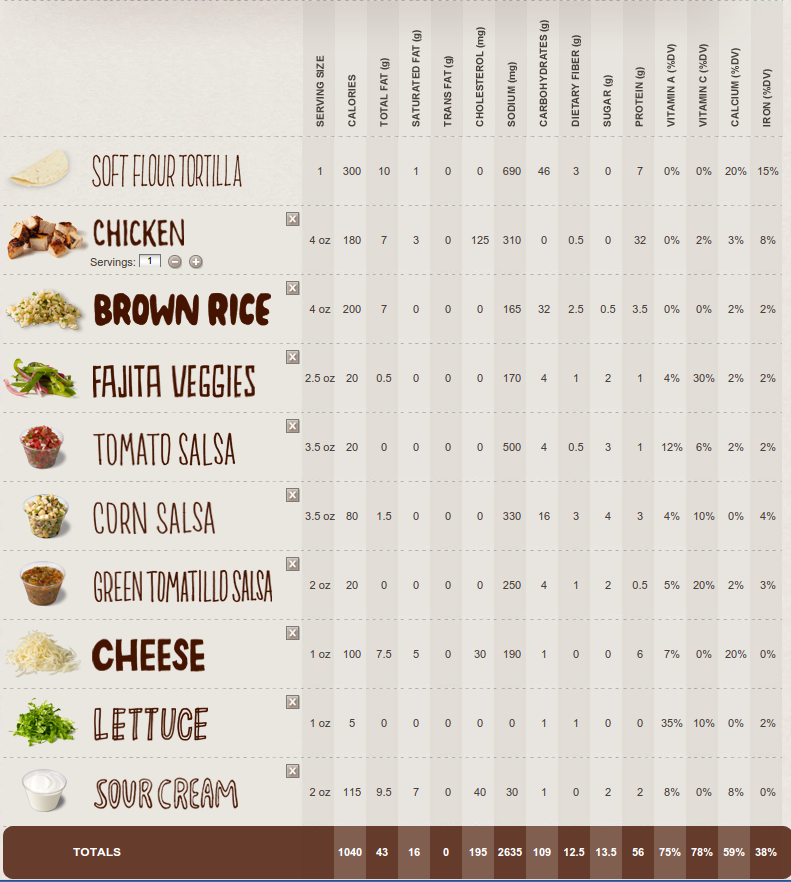
| 21:42, 5 October 2014 | Chipotle2.png (file) |  |
320 KB | 1 | |
| 15:45, 19 June 2017 | ChromeMac.png (file) |  |
32 KB | 1 | |
| 21:40, 10 May 2015 | Chrome shell.png (file) |  |
69 KB | 1 | |
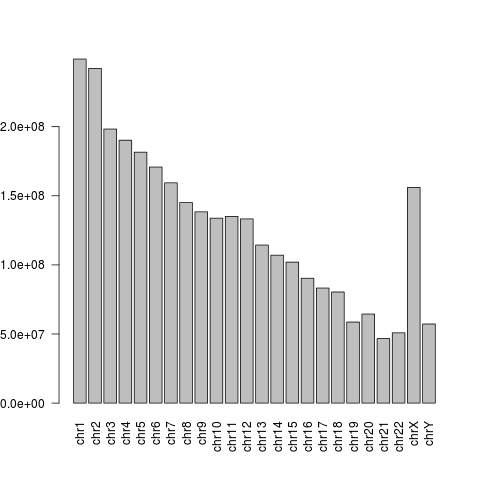
| 13:14, 17 October 2017 | Chromosome len.png (file) |  |
6 KB | 1 | |
| 09:25, 5 June 2016 | Circular qprogress.png (file) |  |
86 KB | 1 | |
| 11:08, 11 February 2023 | ClassPrediction.PNG (file) |  |
34 KB | 1 | |
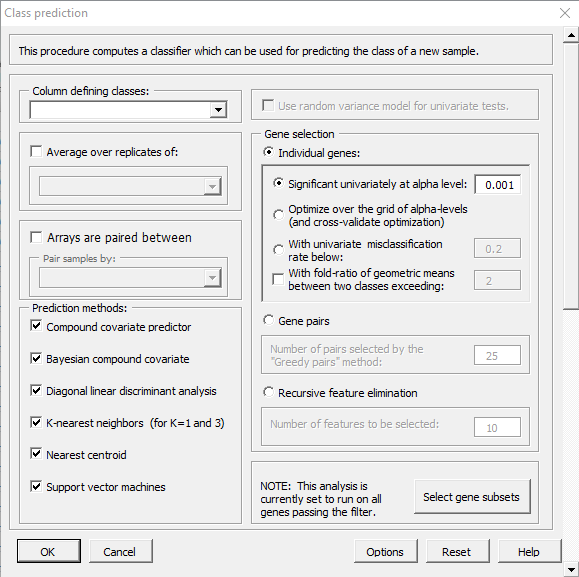
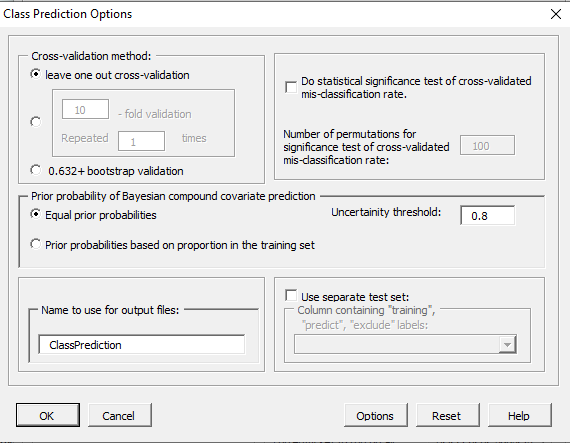
| 11:10, 11 February 2023 | ClassPredictionOptions.PNG (file) |  |
21 KB | 1 | |
| 09:43, 26 September 2020 | Coffeeinteract.png (file) |  |
1.3 MB | 1 | |
| 12:56, 10 May 2022 | ColorRampBlueRed.png (file) |  |
4 KB | 1 | |
| 10:48, 5 November 2014 | Colordiff.png (file) |  |
59 KB | 1 | |
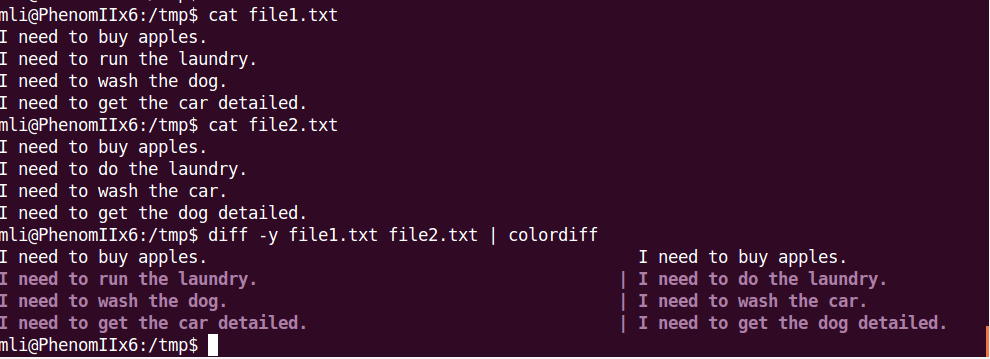
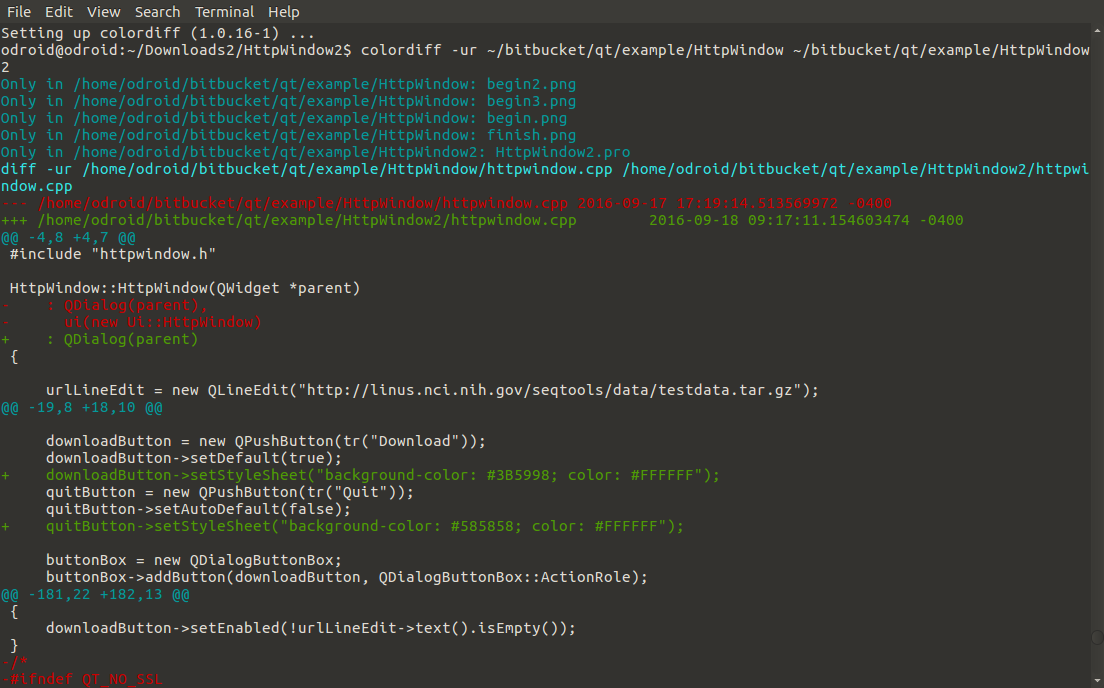
| 09:51, 18 September 2016 | Colordiff2.png (file) |  |
159 KB | 1 | |
| 15:31, 5 September 2016 | Combobox.png (file) |  |
63 KB | 1 | |
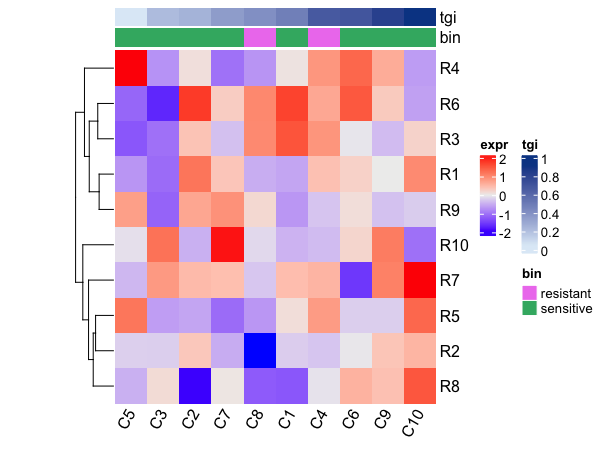
| 15:02, 23 August 2022 | ComplexHeatmap1.png (file) |  |
29 KB | <pre> library(ComplexHeatmap) set.seed(123) ng <- 10; n <- 10 mat = matrix(rnorm(ng * n), n) rownames(mat) = paste0("R", 1:ng) colnames(mat) = paste0("C", 1:n) bin <- sample(c("resistant", "sensitive"), n, replace = TRUE) tgi <- runif(n) # sort the columns by tgi ord <- order(tgi) col_fun = circlize::colorRamp2(range(tgi), c("#DEEBF7", "#084594")) column_ha = HeatmapAnnotation(tgi = tgi[ord], bin = bin[ord], col = list(tgi = col_fun,... | 1 |
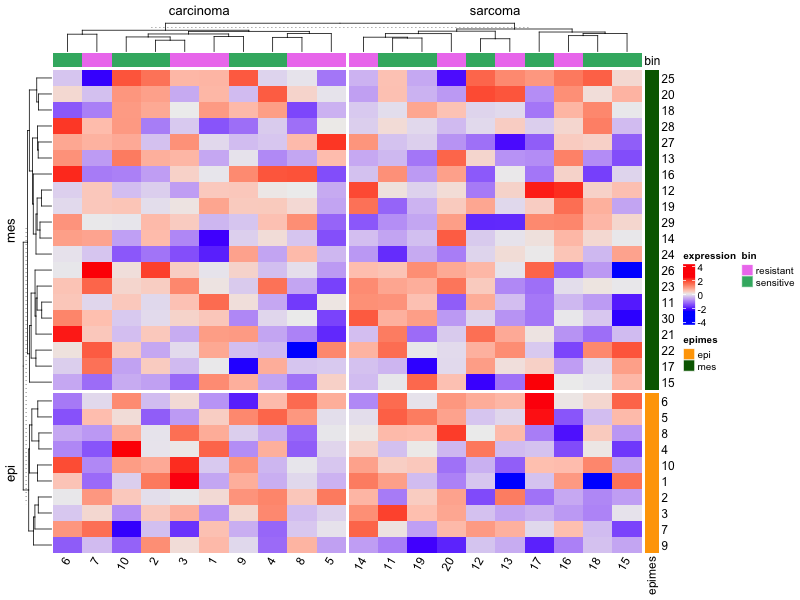
| 21:37, 7 January 2023 | ComplexHeatmap2.png (file) |  |
43 KB | <syntaxhighlight lang="rsplus"> # Simulate data library(ComplexHeatmap) ng <- 30; ns <- 20 set.seed(1) mat <- matrix(rnorm(ng*ns), nr=ng, nc=ns) colnames(mat) <- 1:ns rownames(mat) <- 1:ng # color bar on RHS ind_e <- 1:round(ng/3) ind_m <- (1+round(ng/3)):ng epimes <- rep(c("epi", "mes"), c(length(ind_e), length(ind_m))) row_ha <- rowAnnotation(epimes = epimes, col = list(epimes = c("epi" = "orange", "mes" = "darkgreen"))) # color bar on Top tumortype <- rep(c("carcinoma", "sarcoma"... | 1 |
| 16:57, 29 November 2019 | Conkypi33.png (file) | Error creating thumbnail: File missing |
252 KB | 1 | |
| 09:26, 26 August 2018 | Conkyrpi.png (file) |  |
494 KB | 1 | |
| 14:10, 18 March 2022 | CorVSsnr.svg (file) |  |
44 KB | 1 | |
| 21:46, 10 May 2015 | Crouton ubuntu.png (file) |  |
154 KB | 1 | |
| 21:46, 10 May 2015 | Crouton ubuntu2.png (file) |  |
226 KB | 1 | |
| 12:35, 17 April 2020 | Cvcoxnet.png (file) |  |
1.26 MB | 1 | |
| 16:39, 11 October 2022 | Cvglmnetplot.png (file) |  |
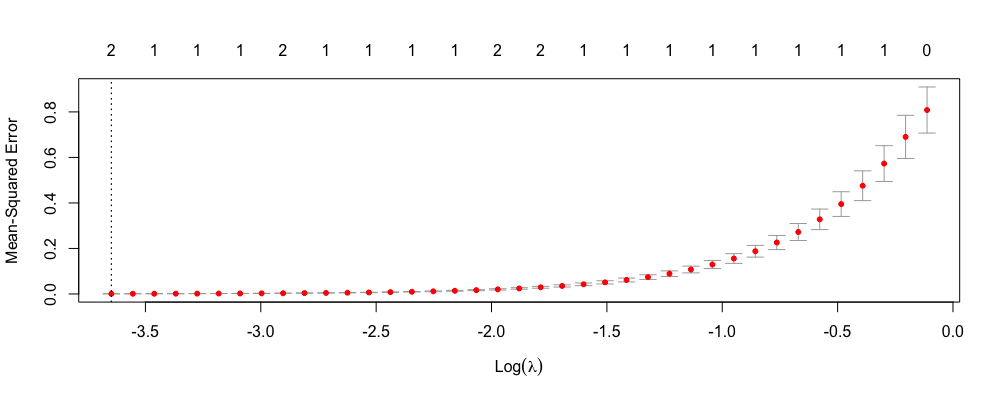
34 KB | <pre> n <- 100 set.seed(1) x1 <- rnorm(n) e <- rnorm(n)*.01 y <- x1 + e x4 <- x fit <- cv.glmnet(x=cbind(x1, x4, matrix(rnorm(n*10), nr=n)), y=y) plot (fit) </pre> | 1 |