File:Pca ggplot2.png: Difference between revisions
Jump to navigation
Jump to search
(<syntaxhighlight lang='r'> df <- iris[, 1:4] # exclude "Species" column pca_res <- prcomp(df, scale = TRUE) ggplot(iris, aes(x = pca_res$x[,1], y = pca_res$x[,2], color = Species)) + geom_point() + stat_ellipse() </syntaxhighlight>) |
(No difference)
|
Latest revision as of 09:58, 23 May 2024
Summary
df <- iris[, 1:4]  # exclude "Species" column

pca_res <- prcomp(df, scale = TRUE)

ggplot(iris,
       aes(x = pca_res$x[,1],
           y = pca_res$x[,2],
           color = Species)) +
  geom_point() +
  stat_ellipse()
File history
Click on a date/time to view the file as it appeared at that time.
| Date/Time | Thumbnail | Dimensions | User | Comment | |
|---|---|---|---|---|---|
| current | 09:58, 23 May 2024 | 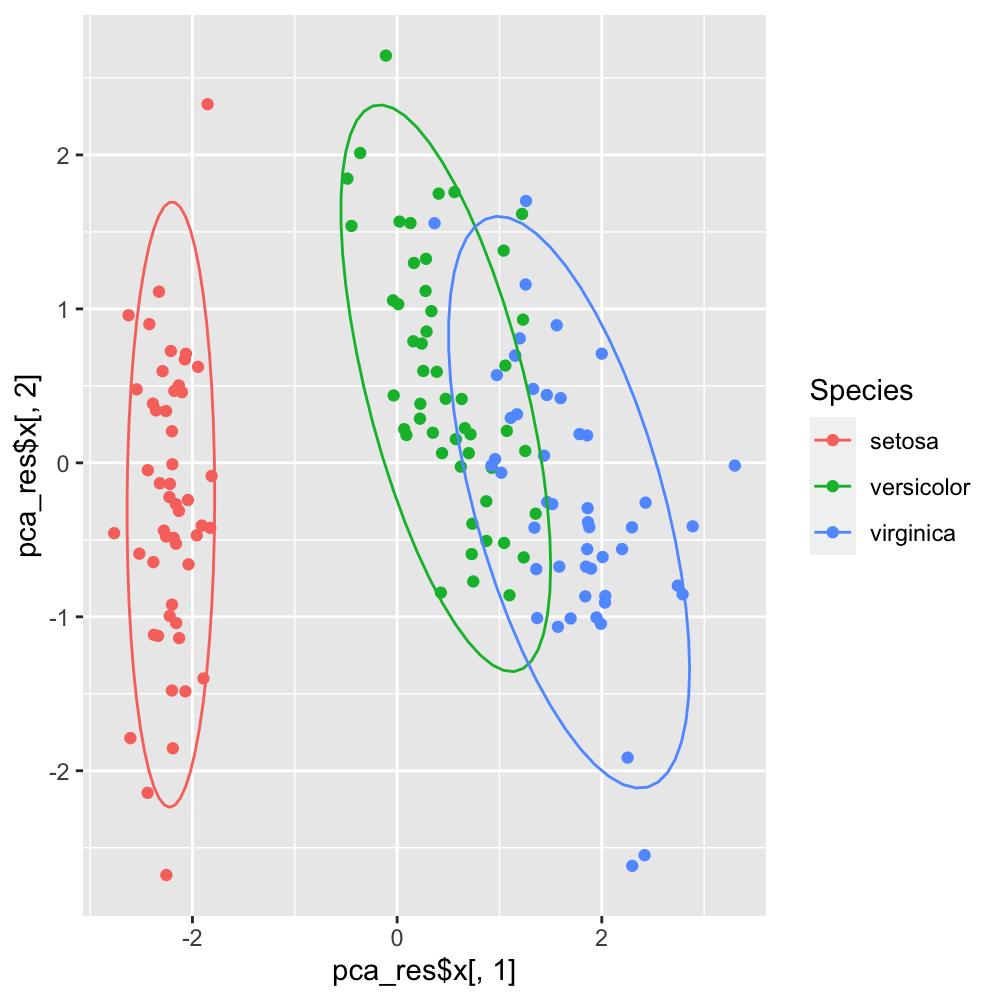 | 1,000 × 1,000 (136 KB) | Brb (talk | contribs) | <syntaxhighlight lang='r'> df <- iris[, 1:4] # exclude "Species" column pca_res <- prcomp(df, scale = TRUE) ggplot(iris, aes(x = pca_res$x[,1], y = pca_res$x[,2], color = Species)) + geom_point() + stat_ellipse() </syntaxhighlight> |
You cannot overwrite this file.
File usage
The following page uses this file: