Heatmap: Difference between revisions
Jump to navigation
Jump to search
(Created page with "= gplots package = The following example is extracted from DESeq2 package. <pre> ## ----loadDESeq2, echo=FALSE---------------------------------------------- # in order to prin...") |
|||
| Line 1: | Line 1: | ||
= gplots package = | = gplots package = | ||
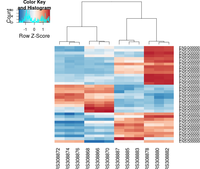
The following example is extracted from DESeq2 package. | The following example is extracted from DESeq2 package. | ||
[[File:Heatmap deseq2.png|200px]] | |||
<pre> | <pre> | ||
## ----loadDESeq2, echo=FALSE---------------------------------------------- | ## ----loadDESeq2, echo=FALSE---------------------------------------------- | ||
Revision as of 09:14, 1 October 2014
gplots package
The following example is extracted from DESeq2 package.

## ----loadDESeq2, echo=FALSE----------------------------------------------
# in order to print version number below
library("DESeq2")

## ----loadExonsByGene, echo=FALSE-----------------------------------------
library("parathyroidSE")
library("GenomicFeatures")
data(exonsByGene)

## ----locateFiles, echo=FALSE---------------------------------------------
bamDir <- system.file("extdata",package="parathyroidSE",mustWork=TRUE)
fls <- list.files(bamDir, pattern="bam$",full=TRUE)


## ----bamfilepaired-------------------------------------------------------
library( "Rsamtools" )
bamLst <- BamFileList( fls, yieldSize=100000 )


## ----sumOver-------------------------------------------------------------
library( "GenomicAlignments" )
se <- summarizeOverlaps( exonsByGene, bamLst,
                         mode="Union",
                         singleEnd=FALSE,
                         ignore.strand=TRUE,
                         fragments=TRUE )

## ----libraries-----------------------------------------------------------
library( "DESeq2" )
library( "parathyroidSE" )

## ----loadEcs-------------------------------------------------------------
data( "parathyroidGenesSE" )
se <- parathyroidGenesSE
colnames(se) <- se$run

## ----fromSE--------------------------------------------------------------
ddsFull <- DESeqDataSet( se, design = ~ patient + treatment )

## ----collapse------------------------------------------------------------
ddsCollapsed <- collapseReplicates( ddsFull,
                                    groupby = ddsFull$sample,
                                    run = ddsFull$run )

## ----subsetCols----------------------------------------------------------
dds <- ddsCollapsed[ , ddsCollapsed$time == "48h" ]

## ----subsetRows, echo=FALSE----------------------------------------------
idx <- which(rowSums(counts(dds)) > 0)[1:4000]
dds <- dds[idx,]

## ----runDESeq, cache=TRUE------------------------------------------------
dds <- DESeq(dds)

rld <- rlog( dds)

library( "genefilter" )
topVarGenes <- head( order( rowVars( assay(rld) ), decreasing=TRUE ), 35 )

## ----beginner_geneHeatmap, fig.width=9, fig.height=9---------------------
library(RColorBrewer)
library(gplots)
heatmap.2( assay(rld)[ topVarGenes, ], scale="row",
           trace="none", dendrogram="column",
           col = colorRampPalette( rev(brewer.pal(9, "RdBu")) )(255))