File:Statsheatmapscaled.png: Difference between revisions
No edit summary |
No edit summary |
||
| Line 1: | Line 1: | ||
<syntaxhighlight lang='r'> | |||
blue_white_red <- colorRampPalette(c("blue", "white", "red"))(100) | |||
stats::heatmap(voom_expr, Rowv = TRUE, # Cluster rows | |||
Colv = TRUE, # Cluster columns | |||
scale = "row", | |||
col = blue_white_red, # Apply custom color palette | |||
main = "Heatmap with Row-Scaled Data" | |||
) | |||
</syntaxhighlight> | |||
Latest revision as of 17:48, 23 December 2024
blue_white_red <- colorRampPalette(c("blue", "white", "red"))(100)

stats::heatmap(voom_expr, Rowv = TRUE,         # Cluster rows
                 Colv = TRUE,         # Cluster columns
                 scale = "row",
                 col = blue_white_red,    # Apply custom color palette
                 main = "Heatmap with Row-Scaled Data"
)
File history
Click on a date/time to view the file as it appeared at that time.
| Date/Time | Thumbnail | Dimensions | User | Comment | |
|---|---|---|---|---|---|
| current | 17:45, 23 December 2024 | 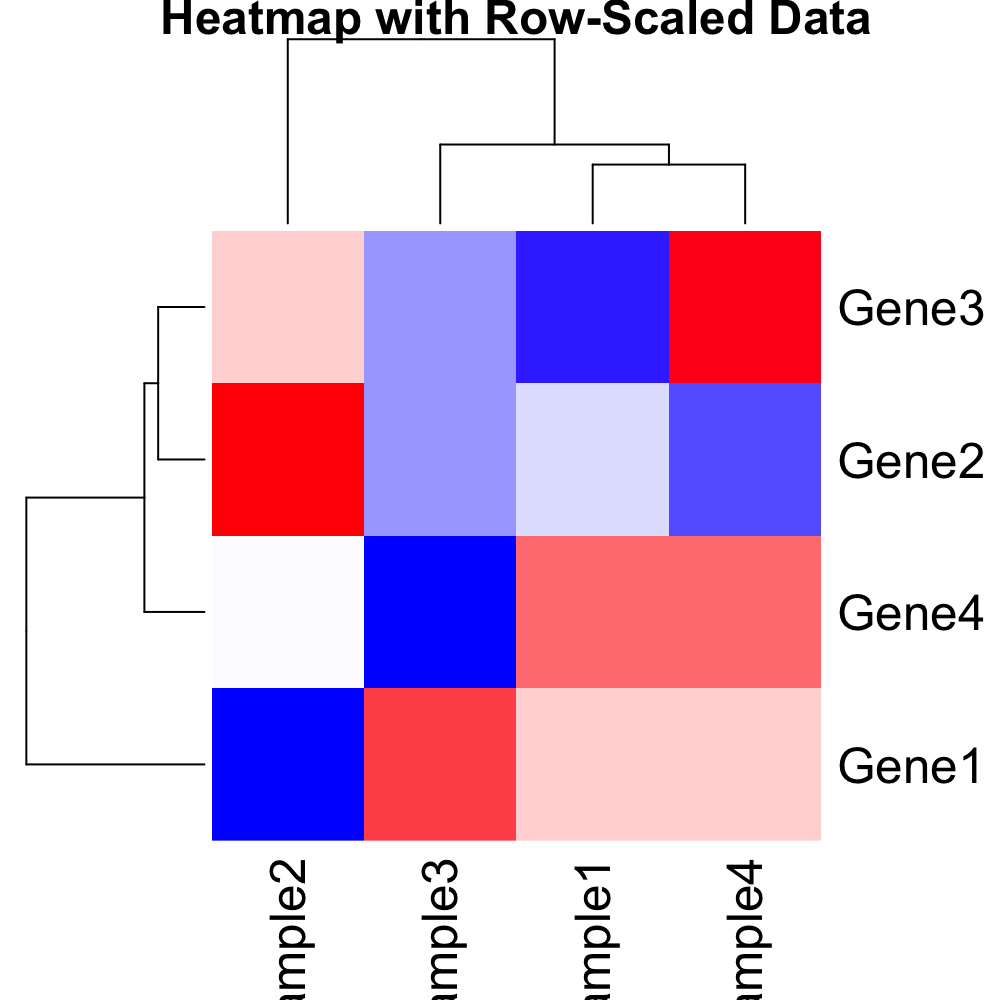 | 1,000 × 1,000 (55 KB) | Brb (talk | contribs) |
You cannot overwrite this file.
File usage
The following page uses this file: