File:Hmscaled2.png
Size of this preview: 600 × 600 pixels. Other resolution: 625 × 625 pixels.
Original file (625 × 625 pixels, file size: 21 KB, MIME type: image/png)
Summary
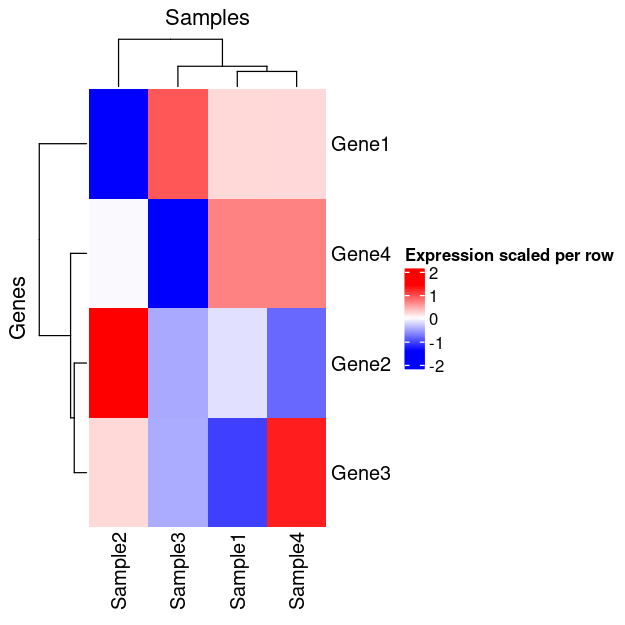
x <- structure(c(16.9966943817533, 17.9931011170293, 17.5792623673341,
     18.5768638712856, 15.6183559348761, 18.605802884533, 17.9288112453195,
     18.4134150861349, 17.6070787425032, 17.8698729193728, 17.7444512372316,
     18.092093724098, 16.9949257540877, 17.7299728705232, 18.2145767113386,
     18.5766893731416), dim = c(4L, 4L),
     dimnames = list(c("Gene1", "Gene2", "Gene3", "Gene4"), c("Sample1", "Sample2", "Sample3","Sample4")))
scaled_x <- t(scale(t(x), center = TRUE, scale = TRUE))  # Row scaling
row_hc <- hclust(dist(x))
col_hc <- hclust(dist(t(x)))

Heatmap(scaled_x,
        name = "Expression scaled per row",
        cluster_rows = as.dendrogram(row_hc),
        cluster_columns = as.dendrogram(col_hc),
        show_row_dend = TRUE,
        show_column_dend = TRUE,
        col = colorRampPalette(c("blue", "white", "red"))(50),
        row_title = "Genes",
        column_title = "Samples")
File history
Click on a date/time to view the file as it appeared at that time.
| Date/Time | Thumbnail | Dimensions | User | Comment | |
|---|---|---|---|---|---|
| current | 21:21, 26 December 2024 | | 625 × 625 (21 KB) | Brb (talk | contribs) | <syntaxhighlight lang='r'> x <- structure(c(16.9966943817533, 17.9931011170293, 17.5792623673341, 18.5768638712856, 15.6183559348761, 18.605802884533, 17.9288112453195, 18.4134150861349, 17.6070787425032, 17.8698729193728, 17.7444512372316, 18.092093724098, 16.9949257540877, 17.7299728705232, 18.2145767113386, 18.5766893731416), dim = c(4L, 4L), dimnames = list(c("Gene1", "Gene2", "Gene3", "Gene4"), c("Sample1", "Sample2", "Sample3","Sample4"))) scaled_x <- t(sca... |
You cannot overwrite this file.
File usage
The following page uses this file: