File:Heatmapcolparam.png
No higher resolution available.
Heatmapcolparam.png (576 × 400 pixels, file size: 27 KB, MIME type: image/png)
Summary
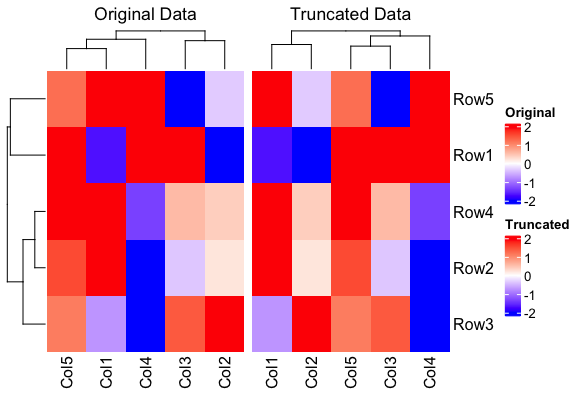
library(ComplexHeatmap)
library(circlize)

# Create a sample 5x5 matrix with values from -4 to 4
set.seed(123)  # for reproducibility
example_matrix <- matrix(runif(25, -4, 4), nrow = 5)
colnames(example_matrix) <- paste0("Col", 1:5)
rownames(example_matrix) <- paste0("Row", 1:5)

# Define the color function that truncates at -2 and 2
col_fun <- colorRamp2(c(-2, 0, 2), c("blue", "white", "red"))

# Plot the heatmap without truncating the data
heatmap1 <- Heatmap(example_matrix, name = "Original",
                    col = col_fun,
                    show_column_names = TRUE,
                    column_title = "Original Data",
                    heatmap_legend_param = list(at = c(-2, -1, 0, 1, 2)))

# Explicitly truncate the data
example_matrix_truncated <- pmin(pmax(example_matrix, -2), 2)

# Plot the heatmap with truncated data
heatmap2 <- Heatmap(example_matrix_truncated, name = "Truncated",
                    col = col_fun,
                    show_column_names = TRUE,
                    column_title = "Truncated Data",
                    heatmap_legend_param = list(at = c(-2, -1, 0, 1, 2)))

# Display both heatmaps side by side
draw(heatmap1 + heatmap2)
File history
Click on a date/time to view the file as it appeared at that time.
| Date/Time | Thumbnail | Dimensions | User | Comment | |
|---|---|---|---|---|---|
| current | 17:37, 31 January 2025 | | 576 × 400 (27 KB) | Brb (talk | contribs) | <syntaxhighlight lang='r'> library(ComplexHeatmap) library(circlize) # Create a sample 5x5 matrix with values from -4 to 4 set.seed(123) # for reproducibility example_matrix <- matrix(runif(25, -4, 4), nrow = 5) colnames(example_matrix) <- paste0("Col", 1:5) rownames(example_matrix) <- paste0("Row", 1:5) # Define the color function that truncates at -2 and 2 col_fun <- colorRamp2(c(-2, 0, 2), c("blue", "white", "red")) # Plot the heatmap without truncating the data heatmap1 <- Heatmap(exa... |
You cannot overwrite this file.
File usage
The following page uses this file: