File:ComplexHeatmap1.png
Jump to navigation
Jump to search
No higher resolution available.
ComplexHeatmap1.png (600 × 450 pixels, file size: 29 KB, MIME type: image/png)
Summary
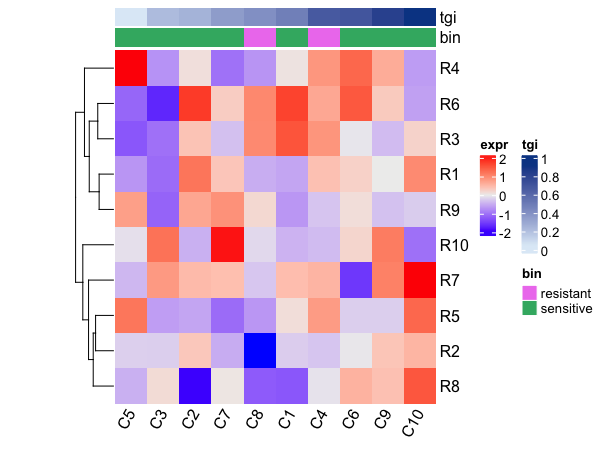
library(ComplexHeatmap)
set.seed(123)
ng <- 10; n <- 10
mat = matrix(rnorm(ng * n), n)
rownames(mat) = paste0("R", 1:ng)
colnames(mat) = paste0("C", 1:n)
bin <- sample(c("resistant", "sensitive"), n, replace = TRUE)
tgi <- runif(n)

# sort the columns by tgi
ord <- order(tgi)

col_fun = circlize::colorRamp2(range(tgi), c("#DEEBF7", "#084594"))
column_ha = HeatmapAnnotation(tgi = tgi[ord],
                              bin = bin[ord],
            col = list(tgi = col_fun,
                       bin = c("resistant" = "violet",
                               "sensitive" = "mediumseagreen")))

p <- mat[, ord] |>
     Heatmap(name = "expr",
          top_annotation = column_ha,
          cluster_columns = FALSE,
          show_row_names = TRUE,
          column_names_rot = 60) |>
     draw(padding = unit(c(2, 20, 2, 2), "mm"))
# svg("~/Downloads/out.svg", width = 8, height = 6)
# p
# dev.off()
File history
Click on a date/time to view the file as it appeared at that time.
| Date/Time | Thumbnail | Dimensions | User | Comment | |
|---|---|---|---|---|---|
| current | 15:02, 23 August 2022 | | 600 × 450 (29 KB) | Brb (talk | contribs) | <pre> library(ComplexHeatmap) set.seed(123) ng <- 10; n <- 10 mat = matrix(rnorm(ng * n), n) rownames(mat) = paste0("R", 1:ng) colnames(mat) = paste0("C", 1:n) bin <- sample(c("resistant", "sensitive"), n, replace = TRUE) tgi <- runif(n) # sort the columns by tgi ord <- order(tgi) col_fun = circlize::colorRamp2(range(tgi), c("#DEEBF7", "#084594")) column_ha = HeatmapAnnotation(tgi = tgi[ord], bin = bin[ord], col = list(tgi = col_fun,... |
You cannot overwrite this file.
File usage
The following page uses this file: