Heatmap
Jump to navigation
Jump to search
Evaluate the effect of centering (mean, median) & scaling on H. clustering using 1-Corr distance and Euclidean distance
1-correlation distance
Effect of centering and scaling on clustering of genes and samples in terms of distance. 'Yes' means the distance was changed compared to the baseline where no centering or scaling was applied.
| clustering genes | clustering samples | |
|---|---|---|
| centering on each genes | No | Yes |
| scaling on each genes | No |
Euclidean distance
| clustering genes | clustering samples | |
|---|---|---|
| centering on each genes | Yes | Yes |
| scaling on each genes | Yes | Yes |
gplots package
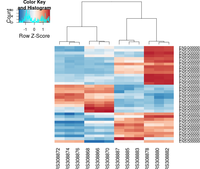
The following example is extracted from DESeq2 package.
## ----loadDESeq2, echo=FALSE----------------------------------------------
# in order to print version number below
library("DESeq2")

## ----loadExonsByGene, echo=FALSE-----------------------------------------
library("parathyroidSE")
library("GenomicFeatures")
data(exonsByGene)

## ----locateFiles, echo=FALSE---------------------------------------------
bamDir <- system.file("extdata",package="parathyroidSE",mustWork=TRUE)
fls <- list.files(bamDir, pattern="bam$",full=TRUE)


## ----bamfilepaired-------------------------------------------------------
library( "Rsamtools" )
bamLst <- BamFileList( fls, yieldSize=100000 )


## ----sumOver-------------------------------------------------------------
library( "GenomicAlignments" )
se <- summarizeOverlaps( exonsByGene, bamLst,
                         mode="Union",
                         singleEnd=FALSE,
                         ignore.strand=TRUE,
                         fragments=TRUE )

## ----libraries-----------------------------------------------------------
library( "DESeq2" )
library( "parathyroidSE" )

## ----loadEcs-------------------------------------------------------------
data( "parathyroidGenesSE" )
se <- parathyroidGenesSE
colnames(se) <- se$run

## ----fromSE--------------------------------------------------------------
ddsFull <- DESeqDataSet( se, design = ~ patient + treatment )

## ----collapse------------------------------------------------------------
ddsCollapsed <- collapseReplicates( ddsFull,
                                    groupby = ddsFull$sample,
                                    run = ddsFull$run )

## ----subsetCols----------------------------------------------------------
dds <- ddsCollapsed[ , ddsCollapsed$time == "48h" ]

## ----subsetRows, echo=FALSE----------------------------------------------
idx <- which(rowSums(counts(dds)) > 0)[1:4000]
dds <- dds[idx,]

## ----runDESeq, cache=TRUE------------------------------------------------
dds <- DESeq(dds)

rld <- rlog( dds)

library( "genefilter" )
topVarGenes <- head( order( rowVars( assay(rld) ), decreasing=TRUE ), 35 )

## ----beginner_geneHeatmap, fig.width=9, fig.height=9---------------------
library(RColorBrewer)
library(gplots)
heatmap.2( assay(rld)[ topVarGenes, ], scale="row",
           trace="none", dendrogram="column",
           col = colorRampPalette( rev(brewer.pal(9, "RdBu")) )(255))
