File:DataOutliers2.png
Jump to navigation
Jump to search
Size of this preview: 558 × 600 pixels. Other resolution: 1,020 × 1,096 pixels.
Original file (1,020 × 1,096 pixels, file size: 133 KB, MIME type: image/png)
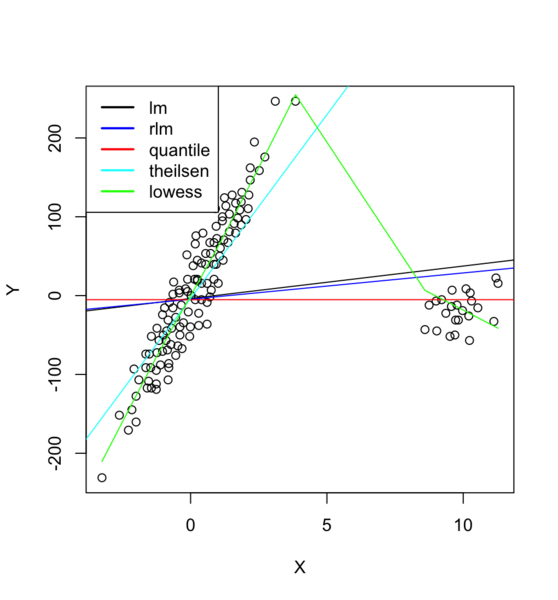
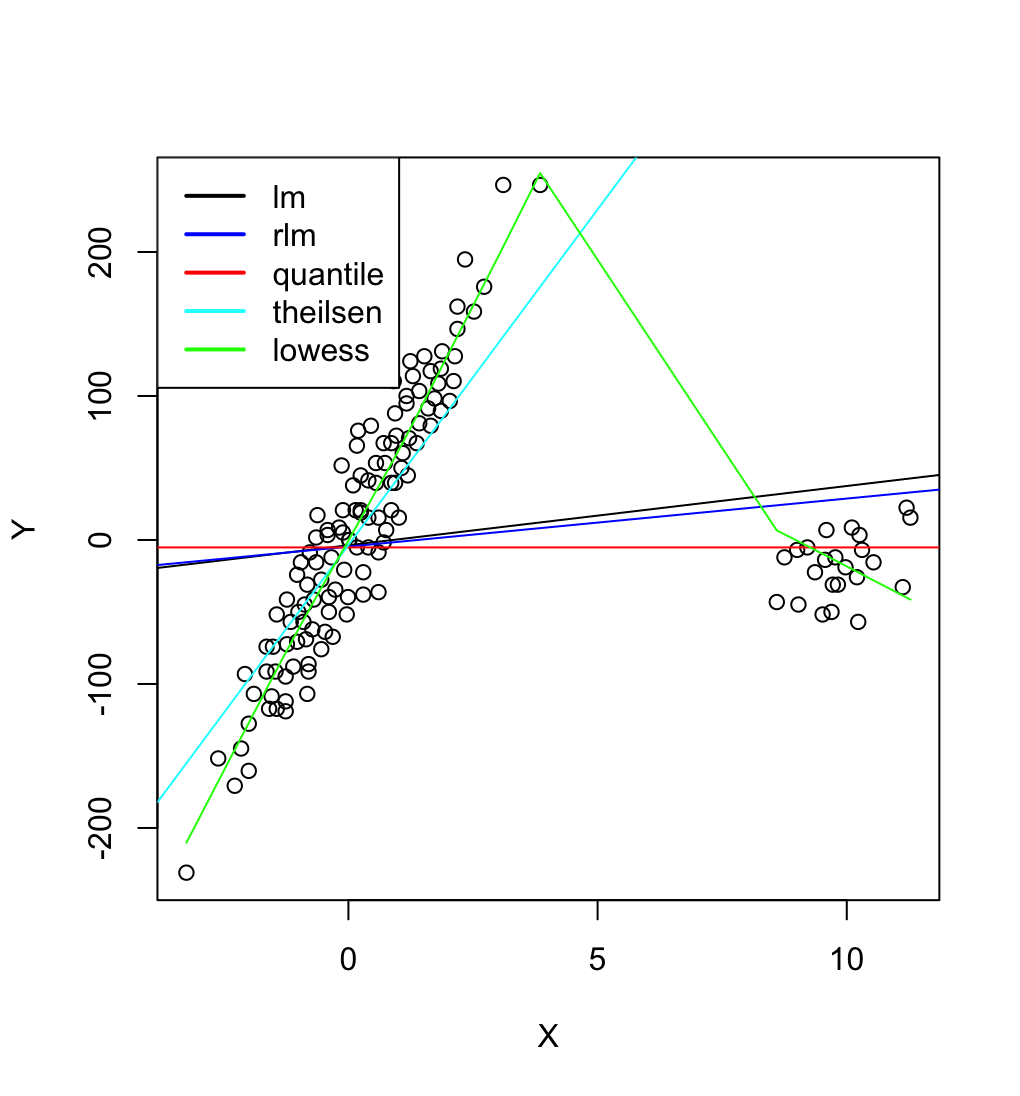
Summary
puree <- read.csv("https://gist.githubusercontent.com/arraytools/e851ed88c7456779557fbf3ed67b157a/raw/9971c61fea1db99acbd9de17ea82679ba9811358/dataOutliers2.csv", header=F)
plot(puree[,1], puree[, 2], xlab="X", ylab="Y")
abline(lm(V2 ~ V1, data = puree))
# robust regression
require(MASS)
summary(rlm(V2 ~ V1, data = puree))
abline(rr.huber <- rlm(V2 ~ V1, data = puree), col = "blue")
# quantile regression
library(quantreg)
abline(rq(V2 ~ V1, data=puree, tau = 0.5), col = "red")
# theilsen
library(RobustLinearReg)
abline(theil_sen_regression(V2 ~ V1, data=puree), col = "cyan")
# loess
lines(lowess(puree$V1, puree$V2), col='green')
legend("topleft", c("lm", "rlm", "quantile", "theilsen", "lowess"),
       col = c("black", "blue", "red", "cyan", "green"), lty=1, lwd=2)
File history
Click on a date/time to view the file as it appeared at that time.
| Date/Time | Thumbnail | Dimensions | User | Comment | |
|---|---|---|---|---|---|
| current | 16:49, 8 March 2024 | | 1,020 × 1,096 (133 KB) | Brb (talk | contribs) | {{Pre}} puree <- read.csv("https://gist.githubusercontent.com/arraytools/e851ed88c7456779557fbf3ed67b157a/raw/9971c61fea1db99acbd9de17ea82679ba9811358/dataOutliers2.csv", header=F) plot(puree[,1], puree[, 2], xlab="X", ylab="Y") abline(lm(V2 ~ V1, data = puree)) # robust regression require(MASS) summary(rlm(V2 ~ V1, data = puree)) abline(rr.huber <- rlm(V2 ~ V1, data = puree), col = "blue") # quantile regression library(quantreg) abline(rq(V2 ~ V1, data=puree, tau = 0.5), col = "red") # theil... |
You cannot overwrite this file.
File usage
The following page uses this file: